Details
-
Bug
-
Resolution: Cannot Reproduce
-
 Not Evaluated
-
None
-
6.4.1
-
None
-
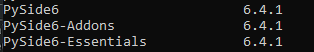
windows 10 python 3.11 PySide6 6.4.1
-
Windows
-
d3ee83e90 (dev), d76459157 (dev), aed604fce (6.4), 17ae2f5ad (6.5), 6e507af60 (6.4), 9ffc1aaef (tqtc/lts-6.2)
Description
import QtCharts in qml
import QtQuick 2.15
import QtQuick.Controls 2.15
import QtCharts 2.15

Item {
    visible: true
    width: 640
    height: 480

    ChartView {
        id: chart
        title: "Top-5 car brand shares in Finland"
        anchors.fill: parent
        legend.alignment: Qt.AlignBottom
        antialiasing: true

        PieSeries {
            id: pieSeries
            PieSlice { label: "Volkswagen"; value: 13.5 }
            PieSlice { label: "Toyota"; value: 10.9 }
            PieSlice { label: "Ford"; value: 8.6 }
            PieSlice { label: "Skoda"; value: 8.2 }
            PieSlice { label: "Volvo"; value: 6.8 }
        }
    }

    Component.onCompleted: {
        // You can also manipulate slices dynamically, like append a slice or set a slice exploded
        othersSlice = pieSeries.append("Others", 52.0);
        pieSeries.find("Volkswagen").exploded = true;
    }
}
get errors: module "QtCharts" is not installed
qml: Did not load any objects, exiting.