-
Bug
-
Resolution: Out of scope
-
 Not Evaluated
-
None
-
6.9, 6.10.0
-
None
-
python 3.13.2 window10
-
Windows
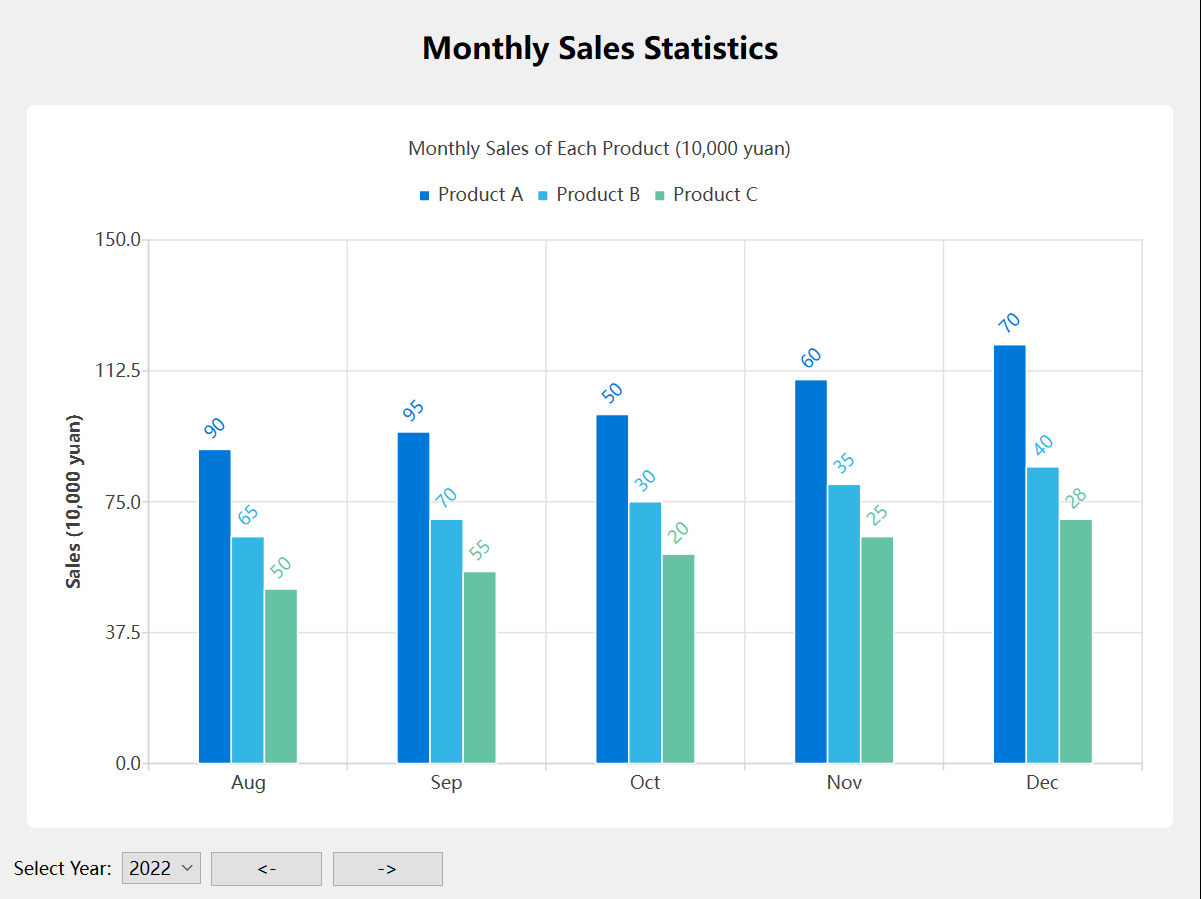
Following is a demo. When run it, it will display the sales bar chart for the period from January to December 2022.
import sys
from PySide6.QtWidgets import (QApplication, QMainWindow, QVBoxLayout,
                               QWidget, QComboBox, QLabel, QHBoxLayout, QPushButton)
from PySide6.QtCharts import QChart, QChartView, QBarSet, QBarSeries, QValueAxis, QBarCategoryAxis
from PySide6.QtCore import Qt
from PySide6.QtGui import QPainter, QColor


class BarChartExample(QMainWindow):
    def __init__(self):
        super().__init__()

        # Set basic window properties
        self.setWindowTitle("PySide6 Bar Chart Example")
        self.setGeometry(100, 100, 800, 600)

        # Create central widget and layout
        central_widget = QWidget()
        self.setCentralWidget(central_widget)
        main_layout = QVBoxLayout(central_widget)

        # Add title
        title_label = QLabel("Monthly Sales Statistics")
        title_label.setAlignment(Qt.AlignmentFlag.AlignCenter)
        title_label.setStyleSheet("font-size: 20px; font-weight: bold; margin: 10px;")
        main_layout.addWidget(title_label)

        # Create chart and add to layout
        self.create_chart()
        main_layout.addWidget(self.chart_view)

        # Add interactive controls
        control_layout = QHBoxLayout()
        main_layout.addLayout(control_layout)

        # Add year selection combo box
        control_layout.addWidget(QLabel("Select Year:"))
        self.year_combobox = QComboBox()
        self.year_combobox.addItems(["2022", "2023", "2024"])
        self.year_combobox.currentTextChanged.connect(self.update_chart_data)
        control_layout.addWidget(self.year_combobox)

        btn = QPushButton("<-")
        btn.clicked.connect(lambda: self.update_axis_x(-1))
        control_layout.addWidget(btn)

        btn = QPushButton("->")
        btn.clicked.connect(lambda: self.update_axis_x(1))
        control_layout.addWidget(btn)

        # Add a spacer to right-align other controls
        control_layout.addStretch()

    def create_chart(self):
        # Create bar series
        self.series = QBarSeries()
        self.series.setLabelsPosition(QBarSeries.LabelsPosition.LabelsOutsideEnd)

        # Initialize data
        self.update_chart_data("2022")

        # Create chart and add series
        self.chart = QChart()
        self.chart.addSeries(self.series)
        self.chart.setTitle("Monthly Sales of Each Product (10,000 yuan)")
        self.chart.setAnimationOptions(QChart.AnimationOption.SeriesAnimations)  # Add animation effect

        # Category axis (X-axis)
        categories = ["Jan", "Feb", "Mar", "Apr", "May", "Jun",
                      "Jul", "Aug", "Sep", "Oct", "Nov", "Dec"]
        self.axis_x = QBarCategoryAxis()
        self.axis_x.append(categories)
        self.chart.addAxis(self.axis_x, Qt.AlignmentFlag.AlignBottom)
        self.series.attachAxis(self.axis_x)

        # Value axis (Y-axis)
        self.axis_y = QValueAxis()
        self.axis_y.setRange(0, 150)  # Set Y-axis range
        self.axis_y.setTitleText("Sales (10,000 yuan)")
        self.chart.addAxis(self.axis_y, Qt.AlignmentFlag.AlignLeft)
        self.series.attachAxis(self.axis_y)

        # Create chart view
        self.chart_view = QChartView(self.chart)
        self.chart_view.setRenderHint(QPainter.RenderHint.Antialiasing)  # Antialiasing

    def update_chart_data(self, year):
        # Clear existing data
        self.series.clear()

        # Set different data based on selected year
        if year == "2022":
            product_a = QBarSet("Product A")
            product_b = QBarSet("Product B")
            product_c = QBarSet("Product C")

            product_a.append([50, 60, 70, 65, 75, 80, 85, 90, 95, 100, 110, 120])
            product_b.append([30, 35, 40, 45, 50, 55, 60, 65, 70, 75, 80, 85])
            product_c.append([20, 25, 28, 30, 35, 40, 45, 50, 55, 60, 65, 70])

            # Set different colors
            product_a.setColor(QColor(0, 120, 215))
            product_a.setLabelColor(QColor(0, 120, 215))
            product_b.setColor(QColor(51, 181, 229))
            product_b.setLabelColor(QColor(51, 181, 229))
            product_c.setColor(QColor(102, 194, 165))
            product_c.setLabelColor(QColor(102, 194, 165))

            self.series.append([product_a, product_b, product_c])

        elif year == "2023":
            product_a = QBarSet("Product A")
            product_b = QBarSet("Product B")
            product_c = QBarSet("Product C")

            product_a.append([60, 70, 80, 75, 85, 90, 95, 100, 105, 110, 120, 130])
            product_b.append([40, 45, 50, 55, 60, 65, 70, 75, 80, 85, 90, 95])
            product_c.append([30, 35, 38, 40, 45, 50, 55, 60, 65, 70, 75, 80])

            product_a.setColor(QColor(0, 120, 215))
            product_a.setLabelColor(QColor(0, 120, 215))
            product_b.setColor(QColor(51, 181, 229))
            product_b.setLabelColor(QColor(51, 181, 229))
            product_c.setColor(QColor(102, 194, 165))
            product_c.setLabelColor(QColor(102, 194, 165))

            self.series.append([product_a, product_b, product_c])

        elif year == "2024":
            product_a = QBarSet("Product A")
            product_b = QBarSet("Product B")
            product_c = QBarSet("Product C")
            product_d = QBarSet("Product D")  # New product in 2024

            product_a.append([70, 80, 90, 85, 95, 100, 105, 110, 115, 120, 130, 140])
            product_b.append([50, 55, 60, 65, 70, 75, 80, 85, 90, 95, 100, 105])
            product_c.append([40, 45, 48, 50, 55, 60, 65, 70, 75, 80, 85, 90])
            product_d.append([20, 25, 30, 35, 40, 45, 50, 55, 60, 65, 70, 75])

            product_a.setColor(QColor(0, 120, 215))
            product_a.setLabelColor(QColor(0, 120, 215))
            product_b.setColor(QColor(51, 181, 229))
            product_b.setLabelColor(QColor(51, 181, 229))
            product_c.setColor(QColor(102, 194, 165))
            product_c.setLabelColor(QColor(102, 194, 165))
            product_d.setColor(QColor(252, 141, 98))
            product_d.setLabelColor(QColor(252, 141, 98))

            self.series.append([product_a, product_b, product_c, product_d])
        self.series.setLabelsVisible(True)
        self.series.setLabelsAngle(-45)
        self.series.setLabelsFormat("@value")

    def update_axis_x(self, d):
        c = self.axis_x.categories()
        start = max(min(c.index(self.axis_x.min()) + d, len(c) - 1 - 4), 0)
        self.axis_x.setRange(c[start], c[start + 4])

if __name__ == "__main__":
    app = QApplication(sys.argv)
    window = BarChartExample()
    window.show()
    sys.exit(app.exec())
When the <- or -> button is clicked, it will zoom in to five bar charts and can be panned left/right. As written in the code, this translation operation is achieved through the setRange of the abscissa. However, when the translation reaches a certain stage, there will be a situation where the bar chart does not match the data label. This Bug has been bothering me for some time. Is it related to the refresh mechanism of the qt bar chart?