I posted this on StackOverflow here. I've copied it over for convenience but the formatting on StackOverflow is probably better.
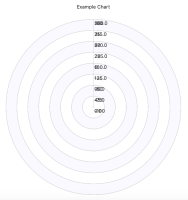
I'm trying to make a polar plot using QtCharts by copying the example here using the source code found linked at the bottom of that page. I've converted the C++ code to PySide2 compatible code, and everything seems to mostly work (i.e. the plot shows up and the series are drawn), but for some reason, the angular axis is labelled incorrectly. When I run my code, the labels for angular axis overlap the labels for the radial axis, despite my adding the angular axis as follows:
self.chart.addAxis(self.angularAxis, QtCharts.QtCharts.QPolarChart.PolarOrientationAngular)
According to the docs, this is what I'm supposed to do for the angular axis, but it doesn't seem to be working. It ends up looking like the attached image.
Below is the code that generates this.
 import sys
 from PySide2 import QtCore, QtWidgets, QtGui, QtCharts

 class Main(QtWidgets.QMainWindow):
     def __init__(self, parent=None):
         super(Main, self).__init__(parent)
         self.angularMin = 0
         self.angularMax = 360

         self.radialMin = -100
         self.radialMax = 100

         self.chart = QtCharts.QtCharts.QPolarChart()
         self.chart.setTitle("Example Chart")

         self.angularAxis = QtCharts.QtCharts.QValueAxis()
         self.angularAxis.setTickCount(9)
         self.angularAxis.setLabelFormat("%.1f")
         self.angularAxis.setShadesVisible(True)
         self.angularAxis.setShadesBrush(QtGui.QBrush(QtGui.QColor(249, 249, 255)))
         self.chart.addAxis(self.angularAxis, QtCharts.QtCharts.QPolarChart.PolarOrientationAngular)

         self.radialAxis = QtCharts.QtCharts.QValueAxis()
         self.radialAxis.setTickCount(9)
         self.radialAxis.setLabelFormat("%d")
         self.chart.addAxis(self.radialAxis, QtCharts.QtCharts.QPolarChart.PolarOrientationRadial)

         self.radialAxis.setRange(self.radialMin, self.radialMax);
         self.angularAxis.setRange(self.angularMin, self.angularMax);

         self.chartView = QtCharts.QtCharts.QChartView(self.chart)
         self.chartView.setRenderHint(QtGui.QPainter.Antialiasing);
         self.setCentralWidget(self.chartView)

 app = QtWidgets.QApplication(sys.argv)
 main = Main()
 main.show()
 sys.exit(app.exec_())
