-
Bug
-
Resolution: Unresolved
-
 P2: Important
-
None
-
5.15.2
-
None
-
Tested on Windows 10 (64-bit) w/ MinGW 8.1.0 and MSVC 2019.
This is a couple of issues that I am reporting together because I'm guessing they all have the same underlying cause.
Issue 1:
When a chart's theme is changed to ChartThemeHighContrast but one or more axes are hidden, the yellow background boxes for that axis are drawn anyways (and their horizontal extents do not reach the edge of the chart.) However, if axis visibility is changed after setting the high contrast theme, everything works properly.
Here is a demonstration, note that if an axis is hidden (buttons on the right) before switching to High Contrast (buttons on the left), the background boxes are broken; but if an axis is displayed or hidden after switching to that theme, the boxes are corrected:

Here is full code for that example:
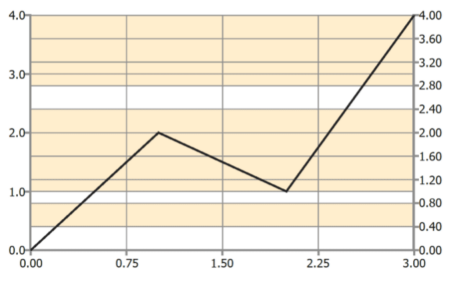
#include <QMainWindow>
#include <QApplication>
#include <QtCharts>

int main (int argc, char *argv[]) {

    static const QStringList themes = { "Light", "Cerulean", "Dark", "Sand",
                                        "NCS", "Contrast", "Icy", "Qt" };

    static const auto withCheck = [](QAction *a, bool checked) {
        a->setCheckable(true);
        a->setChecked(checked);
        return a;
    };

    QApplication::setAttribute(Qt::AA_EnableHighDpiScaling);
    QApplication a(argc, argv);
    QMainWindow w;

    // -------- CHART SETUP --------------------------------------------------

    QLineSeries *series = new QLineSeries;
    series->setName("Extremely Interesting Data");
    series->append(0, 0);
    series->append(1, 2);
    series->append(2, 1);
    series->append(3, 4);

    QChart *chart = new QChart;
    chart->addSeries(series);

    // laxis = left side y axis, xaxis = x axis
    chart->createDefaultAxes();
    QAbstractAxis *laxis = chart->axes(Qt::Vertical).first();

    // raxis = right side y axis
    QValueAxis *raxis = new QValueAxis;
    raxis->setTickCount(11); // so grid lines don't line up with left axis
    chart->addAxis(raxis, Qt::AlignRight);
    series->attachAxis(raxis);

    QChartView *view = new QChartView(chart);
    w.setCentralWidget(view);

    // -------- TOOLBAR SETUP ------------------------------------------------

    QToolBar *toolbar = w.addToolBar("Controls");
    QActionGroup *actions = new QActionGroup(&w);
    for (int theme = 0; theme < themes.size(); ++ theme)
        withCheck(actions->addAction(toolbar->addAction(themes[theme], [&,theme](){
            chart->setTheme((QChart::ChartTheme)theme);
        })), theme == chart->theme());

    toolbar->addSeparator();
    QAction *lvis = withCheck(toolbar->addAction("Left Axis", [&]() {
        laxis->setVisible(lvis->isChecked());
    }), true);
    QAction *rvis = withCheck(toolbar->addAction("Right Axis", [&]() {
        raxis->setVisible(rvis->isChecked());
    }), true);

    // -----------------------------------------------------------------------

    w.resize(800, 600);
    w.show();
    return a.exec();

}
Issue 2:
The second issue is that, when creating a new chart and setting its theme to high contrast, if the theme is set before adding the series or axes to the chart, then the background boxes aren't drawn at all. If the theme is set after adding the series and axes, then the background boxes are drawn correctly.
Here is a demonstration. Each button up to recreates all of the widgets and the chart view, but calls setTheme at different points. Note the presence / absence of background boxes depending on when the theme is set:

Here is full code for that example:
#include <QMainWindow>
#include <QApplication>
#include <QtCharts>

int main (int argc, char *argv[]) {

    QApplication::setAttribute(Qt::AA_EnableHighDpiScaling);
    QApplication a(argc, argv);
    QMainWindow w;

    // -------- CHART SETUP --------------------------------------------------

    const QChart::ChartTheme Theme = QChart::ChartThemeHighContrast;
    enum When { BeforeAddSeries, BeforeAddAxes, BeforeSetView, BeforeShowView, AfterEverything };

    QChartView *view = nullptr;

    static const auto setupChart = [&](When when){ return [&,when]() {

        if (view) {
            view->deleteLater();
            view = nullptr;
        }

        QLineSeries *series = new QLineSeries;
        series->setName("Extremely Interesting Data");
        series->append(0, 0);
        series->append(1, 2);
        series->append(2, 1);
        series->append(3, 4);

        QChart *chart = new QChart;

        if (when == BeforeAddSeries) chart->setTheme(Theme);
        chart->addSeries(series);
        if (when == BeforeAddAxes) chart->setTheme(Theme);
        chart->createDefaultAxes();
        if (when == BeforeSetView) chart->setTheme(Theme);
        view = new QChartView(chart);
        if (when == BeforeShowView) chart->setTheme(Theme);
        w.setCentralWidget(view);
        if (when == AfterEverything) chart->setTheme(Theme);

    }; };

    setupChart(BeforeSetView)();

    // -------- TOOLBAR SETUP ------------------------------------------------

    QToolBar *toolbar = w.addToolBar("Controls");
    toolbar->addAction("BeforeAddSeries", setupChart(BeforeAddSeries));
    toolbar->addAction("BeforeAddAxes", setupChart(BeforeAddAxes));
    toolbar->addAction("BeforeSetView", setupChart(BeforeSetView));
    toolbar->addAction("BeforeShowView", setupChart(BeforeShowView));
    toolbar->addAction("AfterEverything", setupChart(AfterEverything));

    // -----------------------------------------------------------------------

    w.resize(800, 600);
    w.show();
    return a.exec();

}
Issue 3:
This is more of an opinion than an issue: When there are multiple axes in a chart and their tick positions don't line up, the background boxes for all of the axes combine and just sort of make a big mess.
You can see it in the first example above, e.g. note that the boxes cover the union of the alternating grid areas for both axes, leaving oddly sized gaps and being generally not very useful:
However, I don't really have any ideas on how to improve this, other than perhaps making the boxes optional somehow, or just getting rid of them entirely (thus solving all of these problems).
—
The full source for the above two examples is attached, and also available (along with Windows builds) at https://github.com/JC3/chartbug.