-
 Technical task
-
Resolution: Fixed
-
 P2: Important
-
None
-
None
-
Android
-
G&UI Finishing 2023
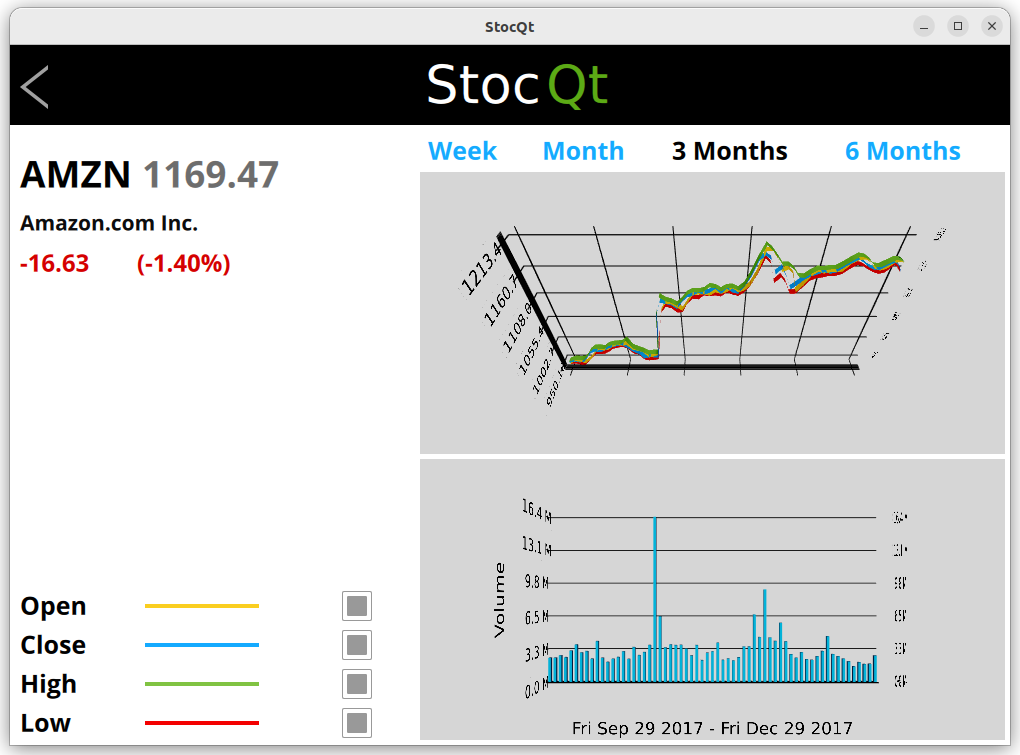
The 2D graphs in current stocqt example will be replaced with 3D graphs rendered with the QtGraphs module. QtGraphs has the possibility to do surface graphs, bar graphs and scatter graphs.
Any of the graphs is capable of showing live data (for the real-time prices), and we need to figure out which one would give the most appealing outcome.
Here's a quick'n'dirty version of the old stocqt example with the 2D graphs replaced with surface graph and bar graph: 