-
Bug
-
Resolution: Unresolved
-
 P2: Important
-
None
-
5.15.6, 5.15.15
-
None
-
Windows
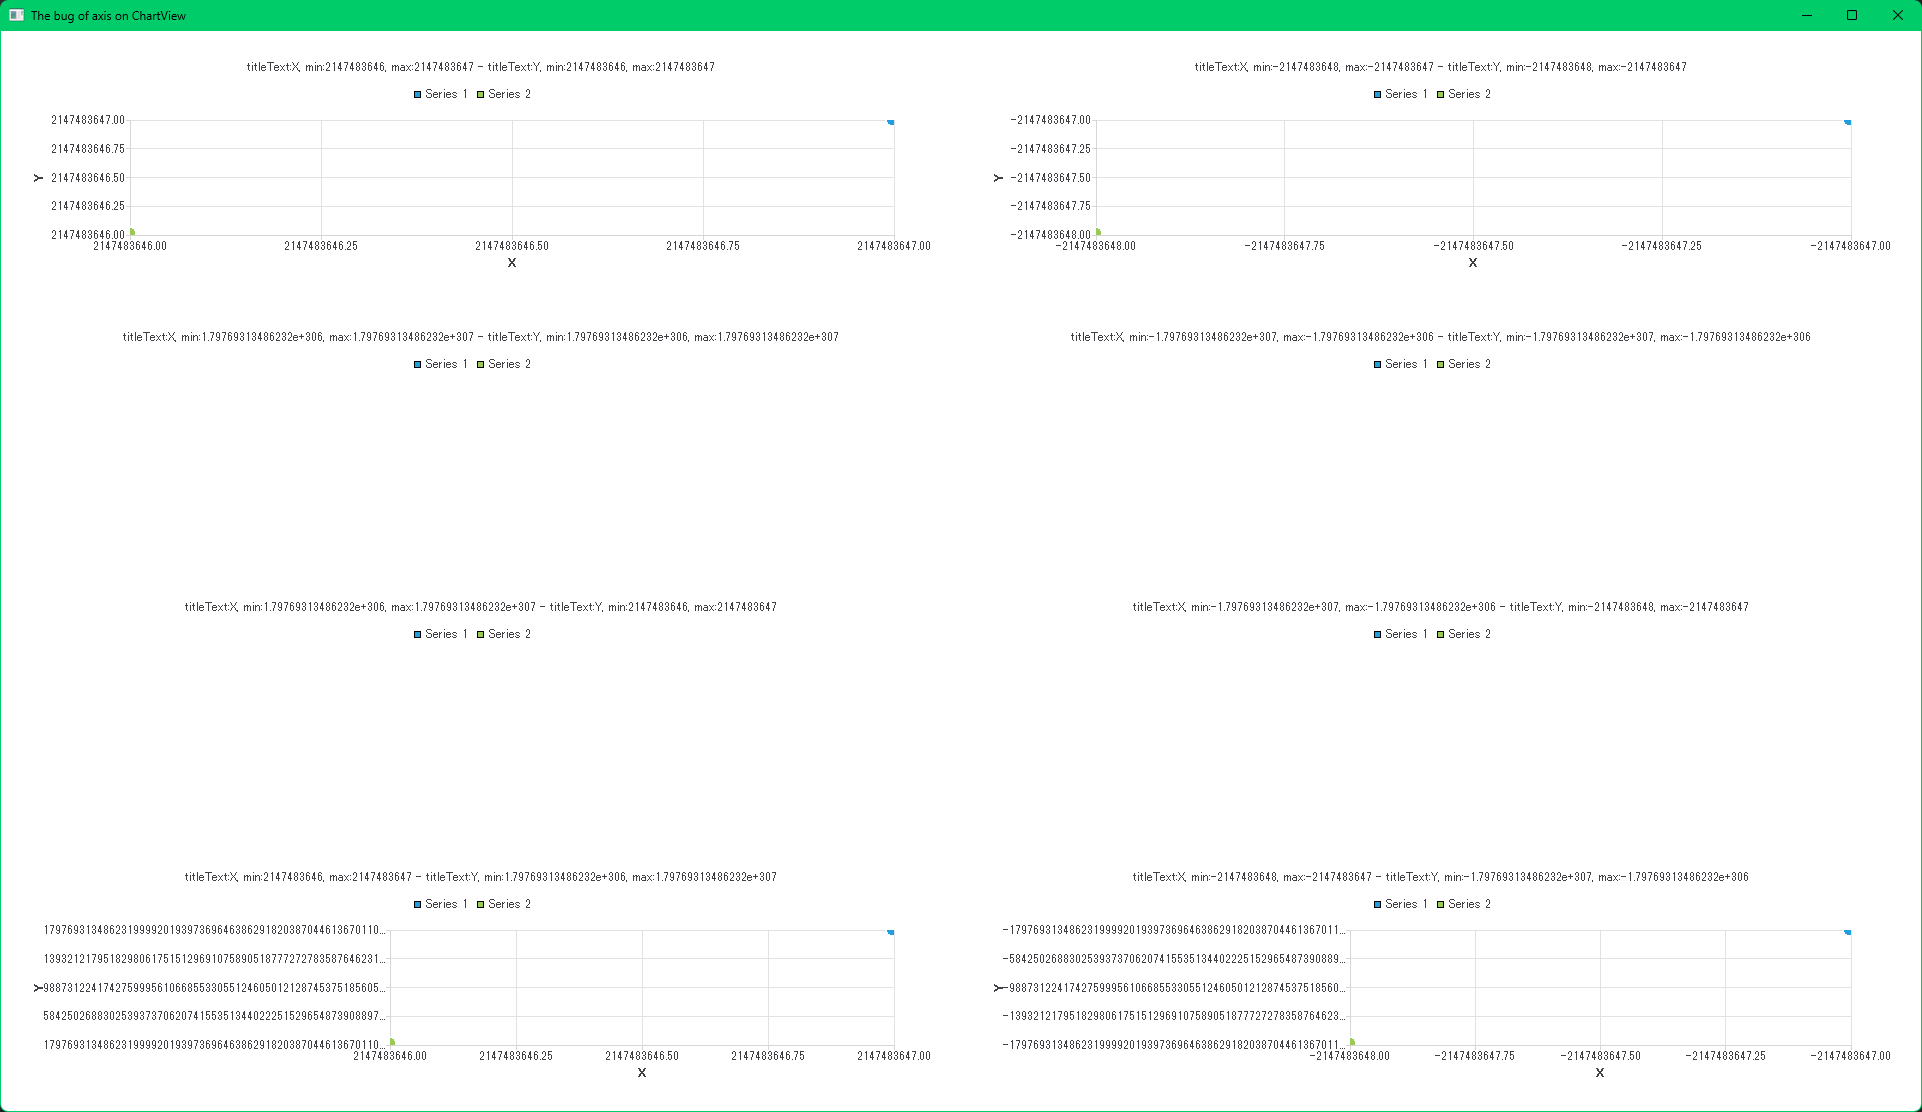
ChartView might not be drawn correctly when the following values are set for min and max of ValueAxis, respectively.
ValueAxis{
    id: xAxis
    titleText: qsTr("X")
    min: 1.79769313486232e+306
    max: 1.79769313486232e+307
}
or
ValueAxis{
    id: xAxis
    titleText: qsTr("X")
    min: -1.79769313486232e+307
    max: -1.79769313486232e+306
}
Qt 5.15.6
Qt 5.15.15