Uploaded image for project: 'Qt'
  1. Qt
  2. QTBUG-119814

Simple Bar Graphs - Example - Yearly total don't light up the right table row

XMLWordPrintable

    • Icon: Bug Bug
    • Resolution: Invalid
    • Icon: P3: Somewhat important P3: Somewhat important
    • None
    • 6.6.1
    • Data Visualization
    • None
    • Windows

      Description:

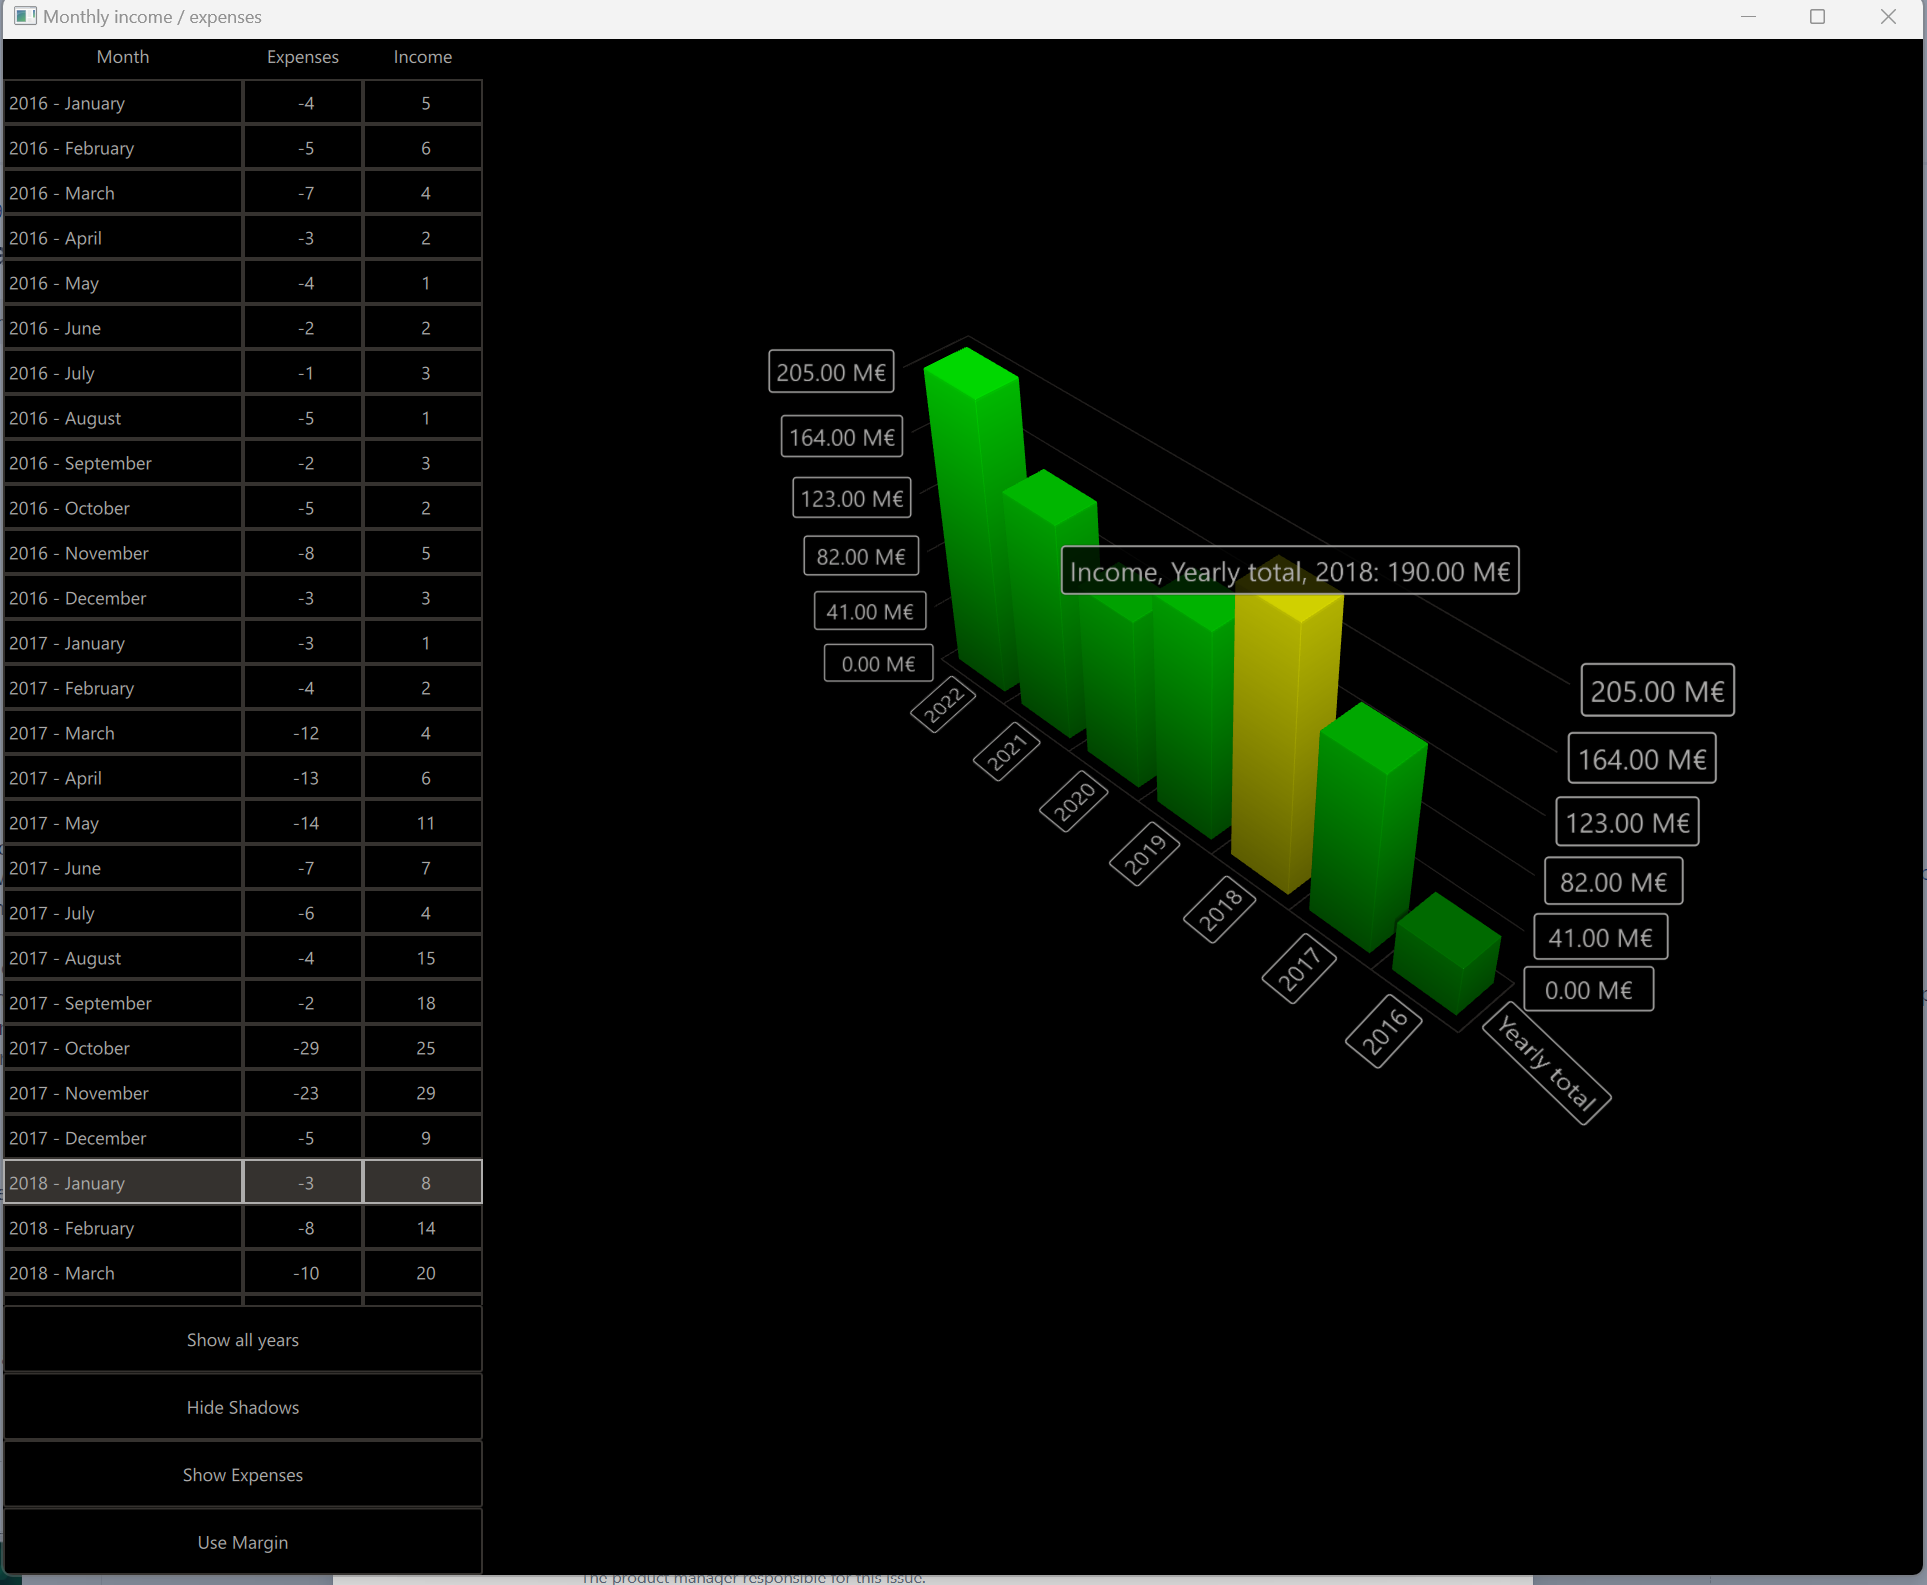
      Hovering the graph for yearly totals lights up the wrong row in the left table. It lights up January of the same year, but the graph is identified as yearly total. It should light up all of the rows corresponding for that year.
      Steps to reproduce:

      1. Open the Simple bar graphs example
      2. Click on show 2020-2022
      3. Click on show yearly totals
      4. Hover over 2018 and you will see in the table on the left January light up.

      Expected behavior:

      The 12 months for the year total hovered over should be light up.
      Observed behavior:

      Only January is light up in the table.
      Special notes:

        No reviews matched the request. Check your Options in the drop-down menu of this sections header.

            tokorpip Tomi Korpipää
            fredericl Frederic Lefebvre
            Votes:
            0 Vote for this issue
            Watchers:
            2 Start watching this issue

              Created:
              Updated:
              Resolved:

                There are no open Gerrit changes