Details
-
Task
-
Resolution: Done
-
 P2: Important
-
None
-
None
Description
QtGraphs (https://doc-snapshots.qt.io/qt6-dev/qtgraphs-index.html) is a module to replace QtCharts (https://doc-snapshots.qt.io/qt6-dev/qtcharts-index.html) and QtDataVisualization (https://doc-snapshots.qt.io/qt6-dev/qtdatavisualization-index.html).
Both QtCharts and QtDataVisualization have built-in themes for color for the following attributes:
- window
- background
- background grid
- label background
- label border
- label font
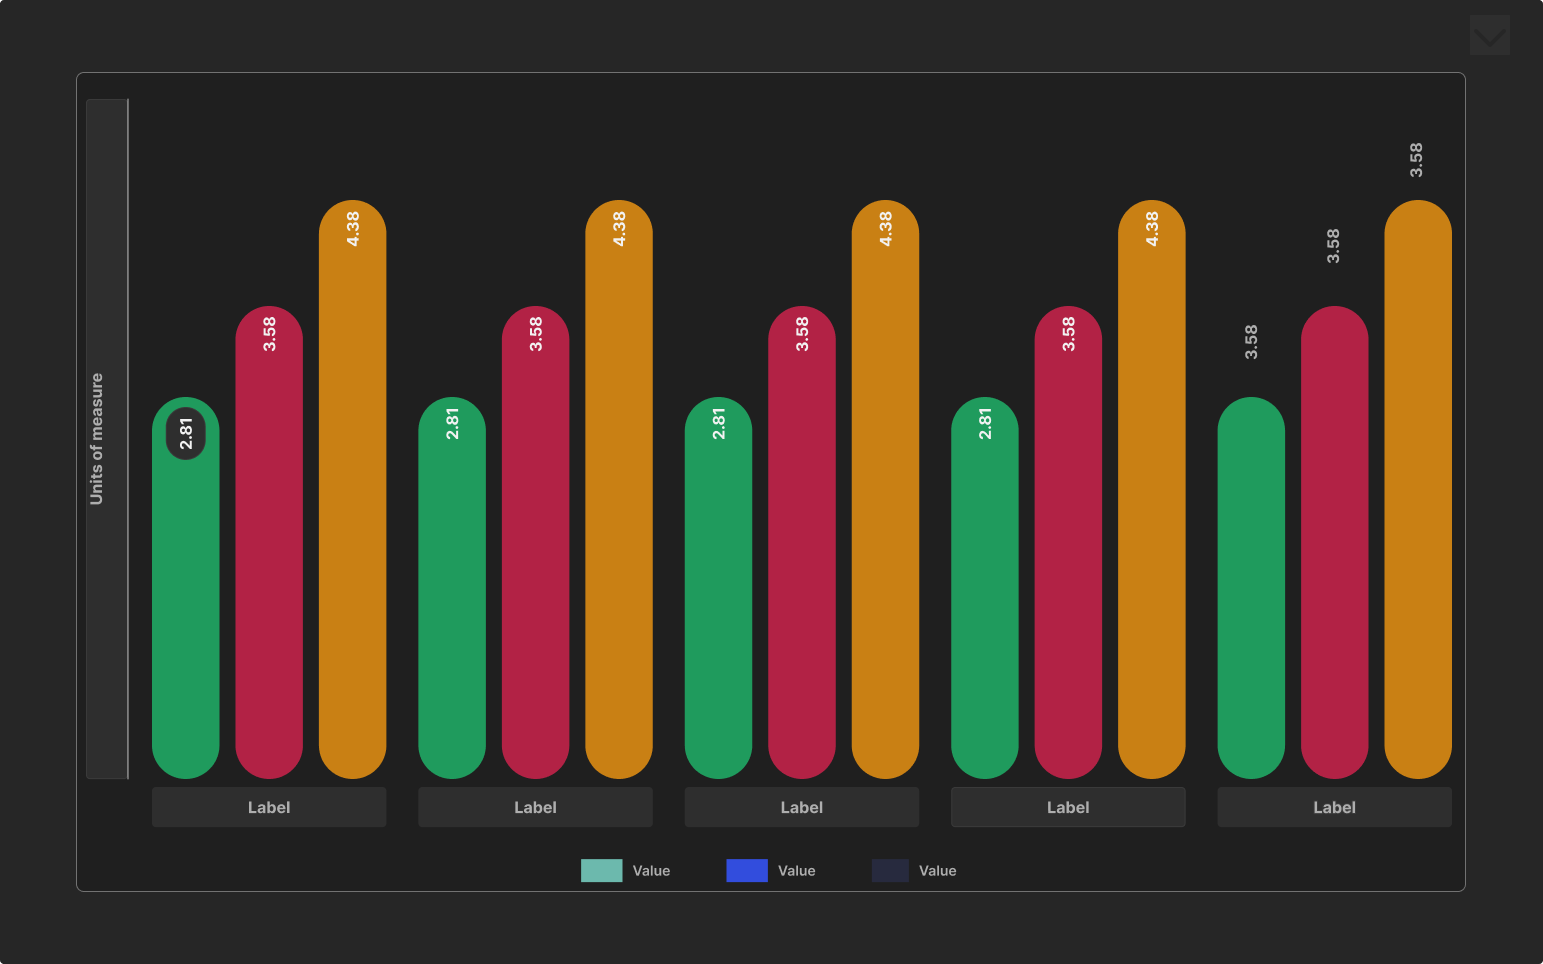
- series x 5 (3D) / ? (2D) (for example bars / lines / scatter point sets) - number can be changed to whatever seems good by UX standpoint. When there are more series' than colors, the colors are re-used from the beginning. The same number of predefined colors should be used for both 3D and 2D in the new design, perhaps?
- selection highlight
- multi-selection highlight
Additionally, the following can be defined by theme:
- label background on/off
- label border on/off
- font family & size
- series coloring is uniform or gradient (gradient is automatically created from uniform color, so no need to define them separately)
- background on/off
- background grid on/off
The themes in use were defined over 10 years ago, so they are outdated and should be brought to modern ages and branding.
Currently there are 7 predefined themes (https://doc-snapshots.qt.io/qt6-dev/q3dtheme.html#Theme-enum), but that number can be changed to anything that is deemed necessary.
Attachments


Issue Links
- is required for
-
-
- Closed
-
-
-
- Closed
-