Uploaded image for project: 'Qt'
  1. Qt
  2. QTBUG-125584

Qt chart does not always show the best fit line correctly

    XMLWordPrintable

Details

    • Bug
    • Resolution: Incomplete
    • P3: Somewhat important
    • None
    • 6.2.7, 6.5.5
    • Charts
    • None

    Description

      Following cases have been tested in both Qt6.2.7 and Qt6.5.5 (test file(test-1.py) has also been attached)

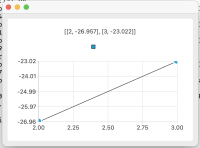
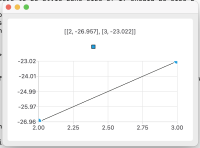
      #Case 1:  points = [[2, -26.957], [3, -23.022]]

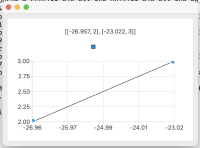
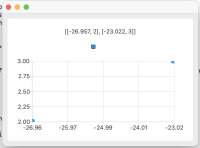
      #Case 2: points = [[ -26.957, 2], [-23.022, 3]]

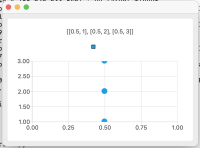
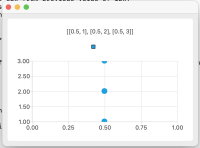
      #Case 3: points = [[0.5, 1], [0.5, 2], [0.5,3]]

      Qt6.2.7 generates best fit line in case 1, but does not generate the best fit line in case 2 and 3.

      Qt6.5.5 generates best fit line in case 1, and 2 but does not generate the best fit line in case 3.
       

      Attachments

        1. 6.2.7_case2.png
          6.2.7_case2.png
          88 kB
        2. 6.2.7_case3.png
          6.2.7_case3.png
          88 kB
        3. 6.5.5_case1.png
          6.5.5_case1.png
          92 kB
        4. 6.5.5_case2.png
          6.5.5_case2.png
          96 kB
        5. 6.5.5_case3.png
          6.5.5_case3.png
          90 kB
        6. 6.2.7_case1.png
          6.2.7_case1.png
          94 kB
        7. test-1.py
          1.0 kB
        No reviews matched the request. Check your Options in the drop-down menu of this sections header.

        Activity

          People

            e0348803 Miikka Heikkinen
            kartik4gupta-sdgr Kartik Gupta
            Votes:
            1 Vote for this issue
            Watchers:
            4 Start watching this issue

            Dates

              Created:
              Updated:
              Resolved:

              Gerrit Reviews

                There are no open Gerrit changes