Details
-
Bug
-
Resolution: Fixed
-
P2: Important
-
6.8
-
None
-
-
4260f8f99 (dev), 49beb688a (6.8), ed1ed146a (6.8.1)
Description
- GraphsTheme "baseColors" and "seriesColors" properties seem to overlap in their roles.


Setting "baseColors" has no effect.
Minimal reproducible example:import QtQuick import QtGraphs Window { id: root width: 1280 height: 960 visible: true title: qsTr("Graphs 3D - Bar Graph") Bars3D { id: barGraph anchors.fill: parent theme: GraphsTheme { theme: GraphsTheme.Theme.UserDefined baseColors: ["red"] } Bar3DSeries { id: barSeries ItemModelBarDataProxy { itemModel: dataModel columnRole: "xPos" rowRole: "zPos" valueRole: "yPos" } } } ListModel { id: dataModel Component.onCompleted: { for (let i = -10; i <= 10; ++i) { for (let j = -10; j <= 10; ++j) { dataModel.append({"xPos": i, "yPos": (i + j), "zPos": j}) } } } } }
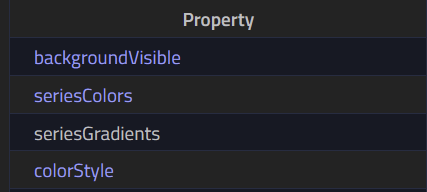
- Mentioned in the GraphsTheme docs "seriesGradients" does not seem to exist:

Attachments
| For Gerrit Dashboard: QTBUG-131124 | ||||||
|---|---|---|---|---|---|---|
| # | Subject | Branch | Project | Status | CR | V |
| 604482,5 | Fix GraphsTheme doc ambiguities | dev | qt/qtgraphs | Status: MERGED | +2 | 0 |
| 604804,2 | Fix GraphsTheme doc ambiguities | 6.8 | qt/qtgraphs | Status: MERGED | +2 | 0 |
| 604889,2 | Fix GraphsTheme doc ambiguities | 6.8.1 | qt/qtgraphs | Status: MERGED | +2 | 0 |


