-
Suggestion
-
Resolution: Fixed
-
 P2: Important
-
None
-
d6192b1ae (dev)
Code
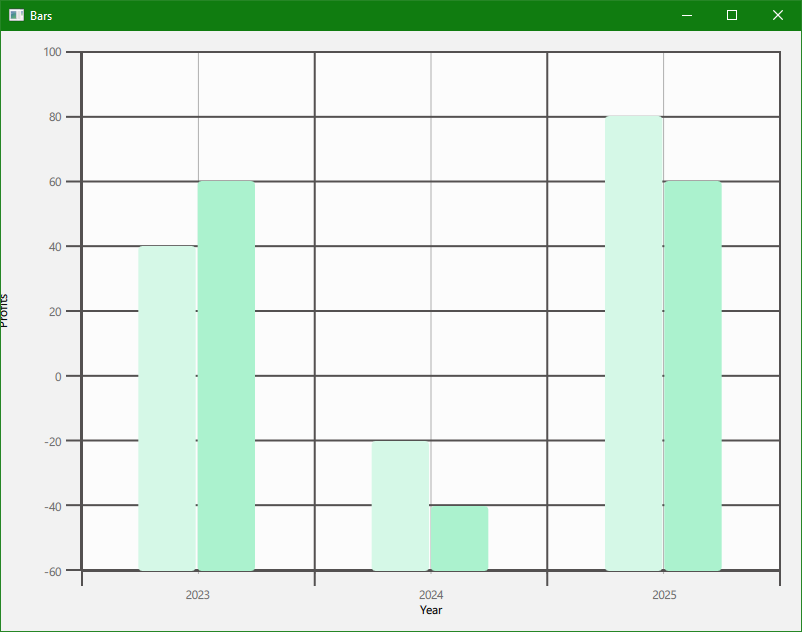
import QtQuick
import QtGraphs

Window {
    width: 800
    height: 600
    visible: true
    title: "Bars"

    GraphsView {
        anchors.fill: parent

        axisX: BarCategoryAxis {
            titleText: "Year"
            categories: [2023, 2024, 2025]
        }
        axisY: ValueAxis {
            titleText: "Profits"
            min: -60
            max: 100
        }

        BarSeries {
            BarSet {
                label: "Dept. A"
                values: [40, -20, 80]
            }
            BarSet {
                label: "Dept. B"
                values: [60, -40, 60]
            }
        }
    }
}
Current Result
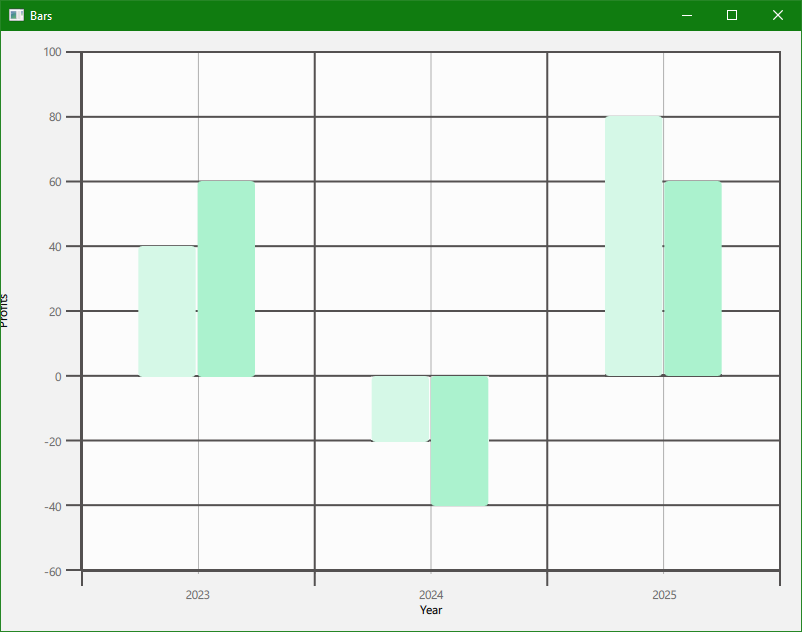
Desired Result

| For Gerrit Dashboard: QTBUG-132483 | ||||||
|---|---|---|---|---|---|---|
| # | Subject | Branch | Project | Status | CR | V |
| 665074,4 | Support BarSeries / BarSets with negative values | dev | qt/qtgraphs | Status: MERGED | +2 | 0 |