-
Bug
-
Resolution: Fixed
-
 P1: Critical
-
6.5.3
-
Other
We are experiencing a potential memory leak when running a basic QtWebEngine-based application on hardware with limited RAM (~1GB). The application loads a simple slideshow webpage (a single HTML file with three PNG images in an img/ directory). The image switch interval is set to 0.5 seconds to reproduce the issue more quickly. Upon execution, the application's virtual memory usage grows continuously until the system has only ~35MB of free memory left. At this point, the application becomes extremely slow, with image transitions occurring at ~5-minute intervals, though it does not completely freeze.
Expected Behavior:
- The application should maintain a reasonable memory footprint without excessive virtual memory growth.
- Image transitions should remain smooth and within the expected interval.
Observed Behavior:
- Right after application startup:

PID VSZ RSS COMMAND
14076 1.5g 149m qtwebengine-test
$ free
total used free shared buff/cache available
Mem: 947.3M 465.4M 151.0M 34.5M 330.9M 381.3M
- After a few minutes:
PID VSZ RSS COMMAND
14076 1.8g 71m qtwebengine-test
$ free
total used free shared buff/cache available
Mem: 947.3M 812.4M 39.0M 34.9M 96.0M 36.5M
- The system becomes unresponsive but does not completely crash.
Suspected Cause:
- Possible memory leak in QtWebEngine leading to excessive virtual memory growth.
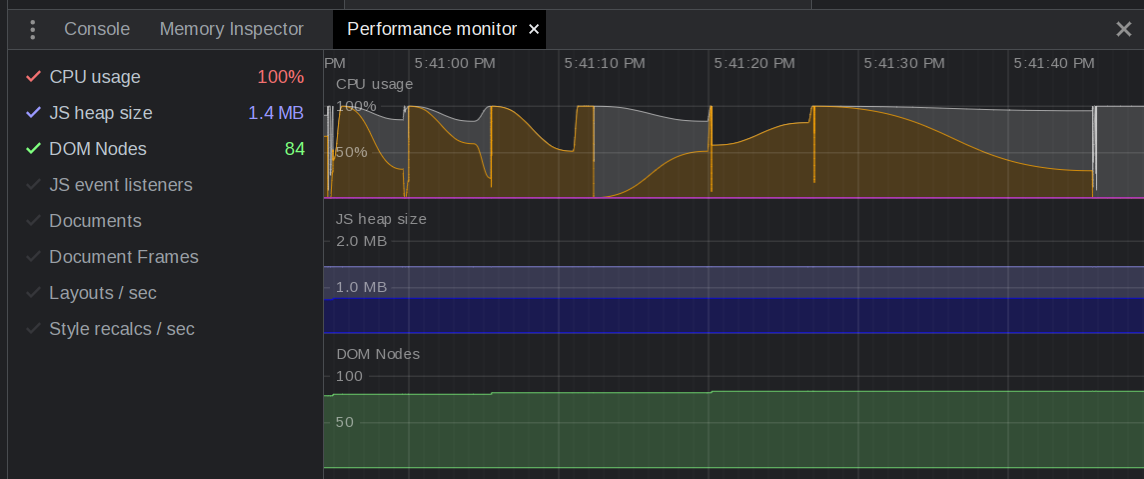
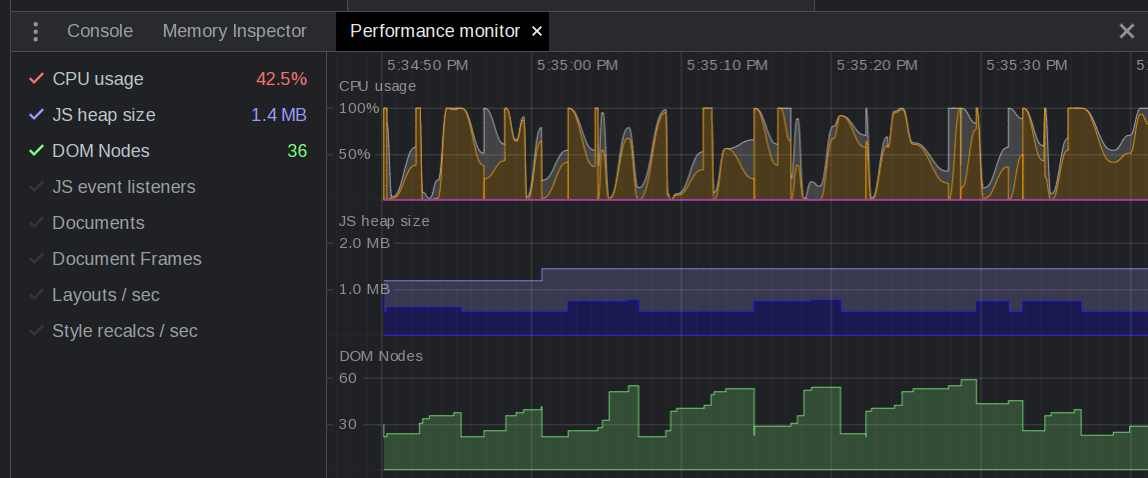
- Potential DOM node leaks or JavaScript heap issues.
- Chromium remote debugging does not confirm JS heap leakage.
- Adjustments to heap size and GC intervals have had no effect.
Reproduction Steps:
- Run the QtWebEngine-based application on the target hardware.
- Load the slideshow webpage.
- Observe memory usage over time.
- Note that the virtual memory usage increases rapidly until the system is nearly out of memory.
Environment Details:
- Hardware: ~1GB RAM system
- QtWebEngine Version: [Specify version]
- Operating System: [Specify OS]
- Environment Variables:
**QTWEBENGINEPROCESS_PATH=/usr/libexec/QtWebEngineProcess QTWEBENGINE_LOCALES_PATH=/usr/share/translations/qtwebengine_locales QTWEBENGINE_RESOURCES_PATH=/usr/share/resources QT_QPA_PLATFORM=wayland-egl USER=root XDG_RUNTIME_DIR=/run/wayland-lvds QTWEBENGINE_CHROMIUM_FLAGS=--remote-debugging-port=7777 --enable-logging --log-level=0 --v=2 --no-sandbox --enable-aggressive-domstorage-flushing --js-flags="--max-old-space-size=1 --max-semi-space-size=1 --optimize-for-size --gc-interval=1"**
Troubleshooting Attempts:
- Monitored memory usage through Chromium remote debugger (no clear heap leaks detected).
- Adjusted QtWebEngine settings to limit heap size and increase garbage collection frequency (no impact observed).
Impact Assessment:
- Application performance degrades significantly over time.
- The issue prevents reliable operation on resource-limited devices.
Next Steps:
- Investigate potential memory leak in QtWebEngine.
- Perform further profiling to determine if DOM nodes are accumulating.
- Validate if issue persists in newer versions of QtWebEngine.
- Consider alternative garbage collection or memory management strategies.

- relates to
-
-
- Closed
-