-
Bug
-
Resolution: Unresolved
-
 P2: Important
-
None
-
6.7, 6.8
-
None
-
Windows
Since the implementation of https://bugreports.qt.io/browse/QTBUG-102835 there exists a function updateChildWindowStackingOrder() in qquickwindow.cpp which iterates recursively over the complete QQuickItem tree of a window whenever somewhere in the window an item is marked as dirty with ChildrenStackingChanged.
This happens also if the visibility of an item changes.
If a GUI is very complex the polish time of a rendered frame can take several milliseconds if this is triggered. In our own application we disabled vsync to reach 200FPS and our GUI has a lot of changes that happen often including dynamic created elements or visibility changes. The FPS can drop significantly in these cases.
Especially since we don't even use the feature of WindowContainer for which this loop was implemented.
I implemented a minimal example in QML for running with qml.exe that creates 100.000 child elements and toggles the visibility of a rectangle very often.
When you enable the logging category for the renderloop timing you can see that the polish time increases to several milliseconds when the visibility toggle is switched on (depending on your machine speed)
qt.scenegraph.time.renderloop.debug=true
qt.scenegraph.time.renderloop: [window 0x2998af3d1c0][render thread 0x2998af97640] syncAndRender: frame rendered in 16ms, sync=0, render=0, swap=16
qt.scenegraph.time.renderloop: [window 0x2998af3d1c0][render thread 0x2998af97640] syncAndRender: start, elapsed since last call: 16 ms
qt.scenegraph.time.renderloop: [window 0x2998af3d1c0][gui thread] Frame prepared, polish=3 ms, lock=0 ms, blockedForSync=7 ms, animations=0 ms
In Qt 6.6 the polish time stays at 0ms
qt.scenegraph.time.renderloop: [window 0x15003772c10][render thread 0x150037d3bb0] syncAndRender: frame rendered in 16ms, sync=0, render=5, swap=10
qt.scenegraph.time.renderloop: [window 0x15003772c10][render thread 0x150037d3bb0] syncAndRender: start, elapsed since last call: 16 ms
qt.scenegraph.time.renderloop: [window 0x15003772c10][gui thread] Frame prepared, polish=0 ms, lock=0 ms, blockedForSync=9 ms, animations=0 ms
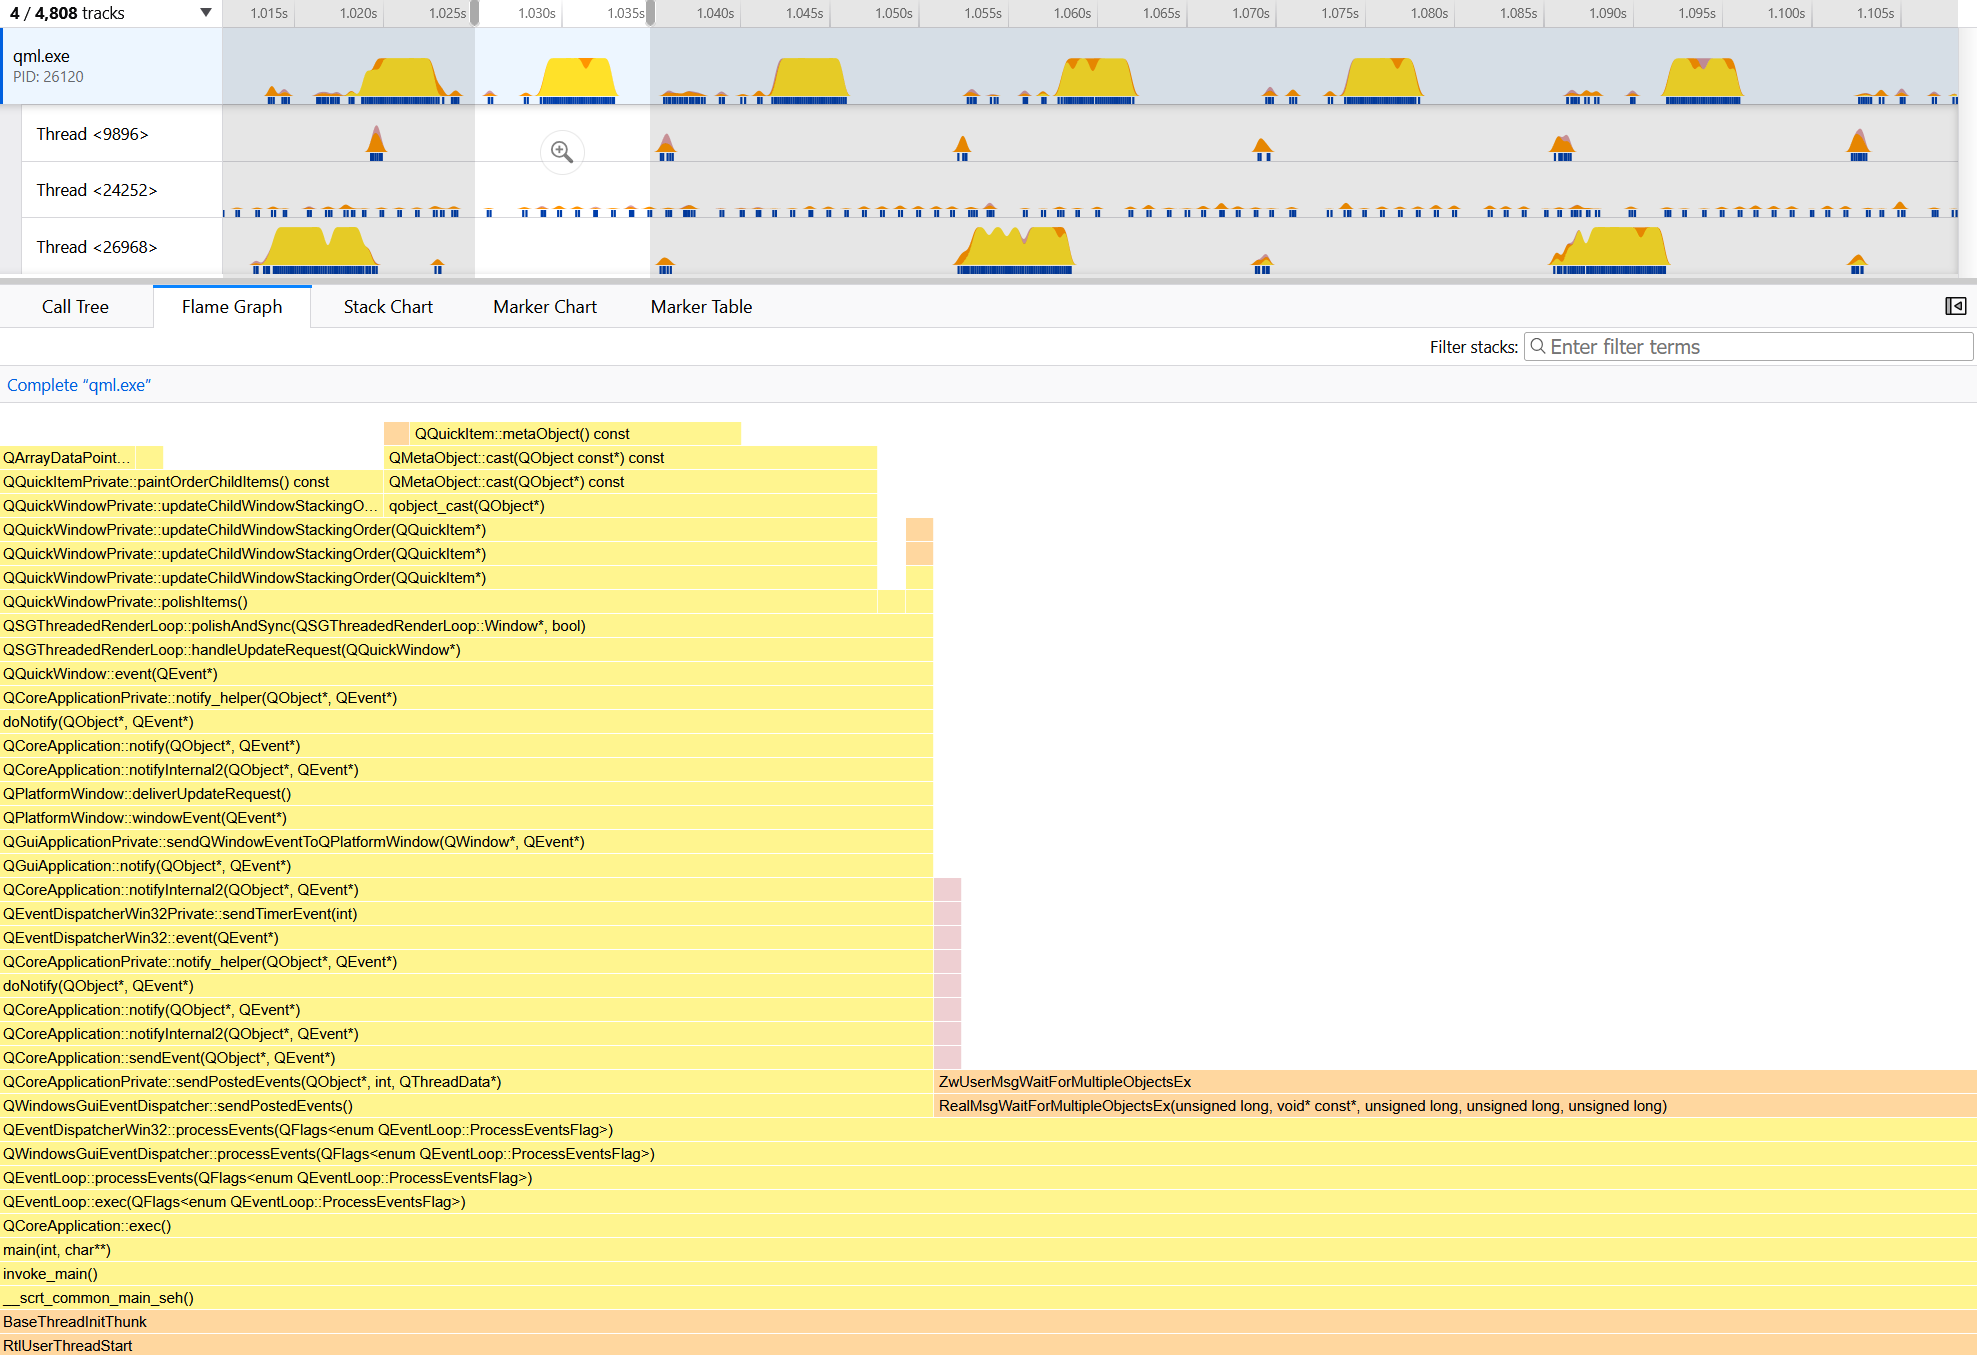
As you can see in the attached flame graph a significant timeslot is spent in updateChildWindowStackingOrder and in there in qobject_cast since each QQuickItem* is tried to be cast to QQuickWindowContainer*