import QtQuick
import QtGraphs
Window {
width: 600
height: 400
visible: true
GraphsView {
anchors.fill: parent
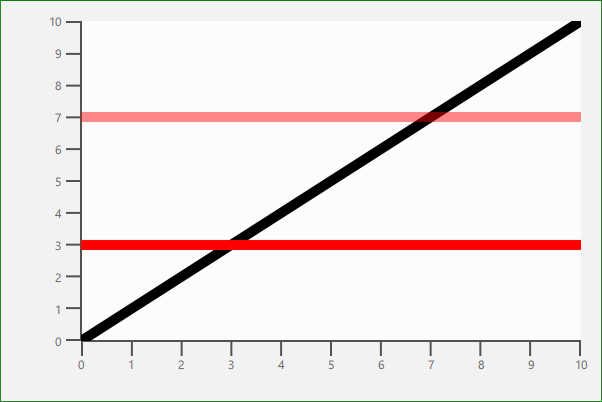
LineSeries {
width: 10
color: "black"
XYPoint { x: 0; y: 0 }
XYPoint { x: 10; y: 10 }
}
LineSeries {
width: 10
color: "red"
opacity: 0.5 XYPoint { x: 0; y: 3 }
XYPoint { x: 10; y: 3 }
}
LineSeries {
width: 10
color: "#77FF0000" XYPoint { x: 0; y: 7 }
XYPoint { x: 10; y: 7 }
}
axisX: ValueAxis { min: 0; max: 10 }
axisY: ValueAxis { min: 0; max: 10 }
theme: GraphsTheme {
colorScheme: GraphsTheme.ColorScheme.Light
gridVisible: false
}
}
}
Bug
 P2: Important