-
Suggestion
-
Resolution: Fixed
-
 P2: Important
-
6.9.1
-
None
-
e4e6ac4ae (dev)
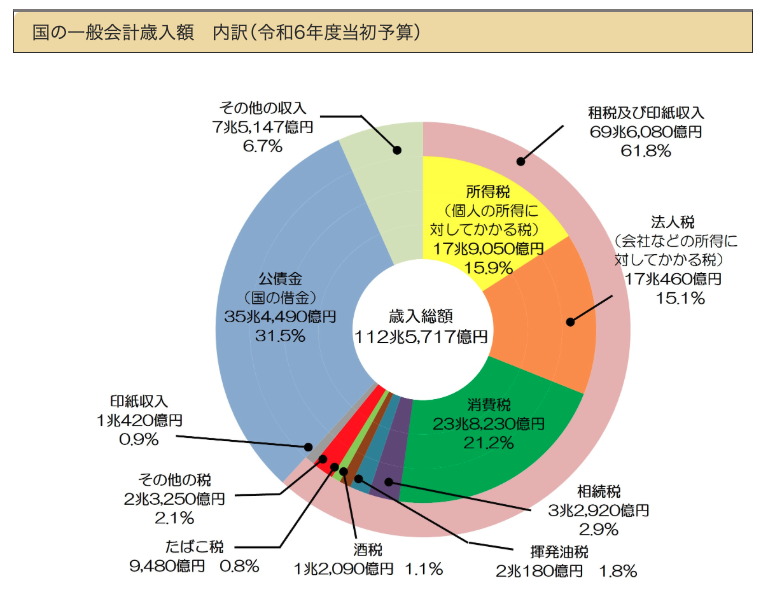
The chart below is from https://www.nta.go.jp/taxes/kids/hatten/page17.htm and it shows an official data for Japanese government's budget for a certain year.
As you can see, on the right side of the chart, there's a large "meta" slice which takes up 61.8% of the pie chart.
Inside it, there are "sub" slices, such as the yellow one with 15.9%, orange one with 15.1%, etc.
I've tried this;
PieSeries {
  PieSlice { // meta
    label: "meta slice"
    value: 2
    PieSlice { // sub
      id: sub1
      value: 1
    }
    PieSlice { // sub
      id: sub2
      value: 3
    }
  }
  PieSlice {
    value: 1
  }
}
But unfortunately it failed with this runtime error;
Cannot assign to non-existent default property
Qt Graphs 2D should allow users to draw this chart easily.
