-
Suggestion
-
Resolution: Unresolved
-
 P3: Somewhat important
-
None
-
6.8.3, 6.9.1
Our users are looking for a plot like this:
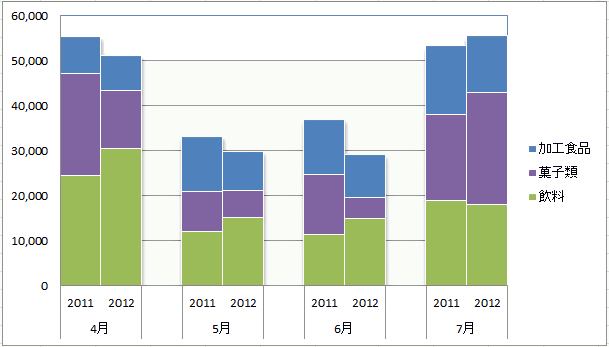
The basic idea is that each of the 2 bar series instances, namely 2011 and 2012, should be grouped into 1 category, i.e. "4月~7月" which just means April~July. Or in other words, there are actually 8 categories, but every 2 of them are grouped together and nested in another category.
Currently, I don't see how it is possible in Qt Graphs. So please consider adding that.
