-
Suggestion
-
Resolution: Fixed
-
 P3: Somewhat important
-
None
-
None
-
49ede1e2e (dev)
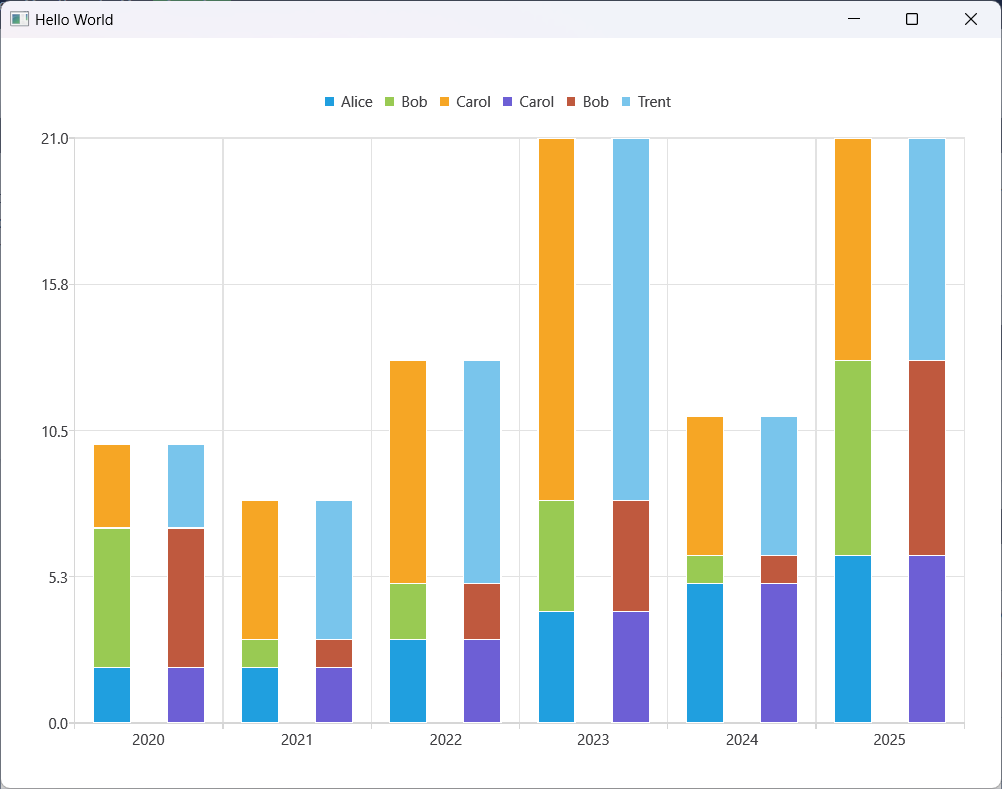
In Qt Charts, i.e. ChartsView + BarSeries, multiple BarSeries instances are going to be rendered separately. For example, that:
    ChartView {
        anchors.fill: parent

        BarCategoryAxis {
            id: bar

            categories: ["2020", "2021", "2022", "2023", "2024", "2025"]
        }

        StackedBarSeries {
            axisX: bar

            BarSet {
                label: "Alice"
                values: [2, 2, 3, 4, 5, 6]
            }

            BarSet {
                label: "Bob"
                values: [5, 1, 2, 4, 1, 7]
            }

            BarSet {
                label: "Carol"
                values: [3, 5, 8, 13, 5, 8]
            }
        }

        StackedBarSeries {
            axisX: bar

            BarSet {
                label: "Carol"
                values: [2, 2, 3, 4, 5, 6]
            }

            BarSet {
                label: "Bob"
                values: [5, 1, 2, 4, 1, 7]
            }

            BarSet {
                label: "Trent"
                values: [3, 5, 8, 13, 5, 8]
            }
        }
    }
is going to look like:

But in Qt Graphs, doing similar thing:
    GraphsView {
        id: graphsView
        anchors.fill: parent
        axisX: bar

        BarCategoryAxis {
            id: bar
            categories: ["2020", "2021", "2022", "2023", "2024", "2025"]
        }

        BarSeries {
            id: series0
            barsType: BarSeries.BarsType.Stacked

            BarSet {
                label: "Alice"
                values: [2, 2, 3, 4, 5, 6]
            }

            BarSet {
                label: "Bob"
                values: [5, 1, 2, 4, 1, 7]
            }

            BarSet {
                label: "Carol"
                values: [3, 5, 8, 13, 5, 8]
            }
        }

        BarSeries {
            id: series1
            barsType: BarSeries.BarsType.Stacked

            BarSet {
                label: "Carol"
                values: [2, 2, 3, 4, 5, 6]
            }

            BarSet {
                label: "Bob"
                values: [5, 1, 2, 4, 1, 7]
            }

            BarSet {
                label: "Trent"
                values: [3, 5, 8, 13, 5, 8]
            }
        }
    }
results in:
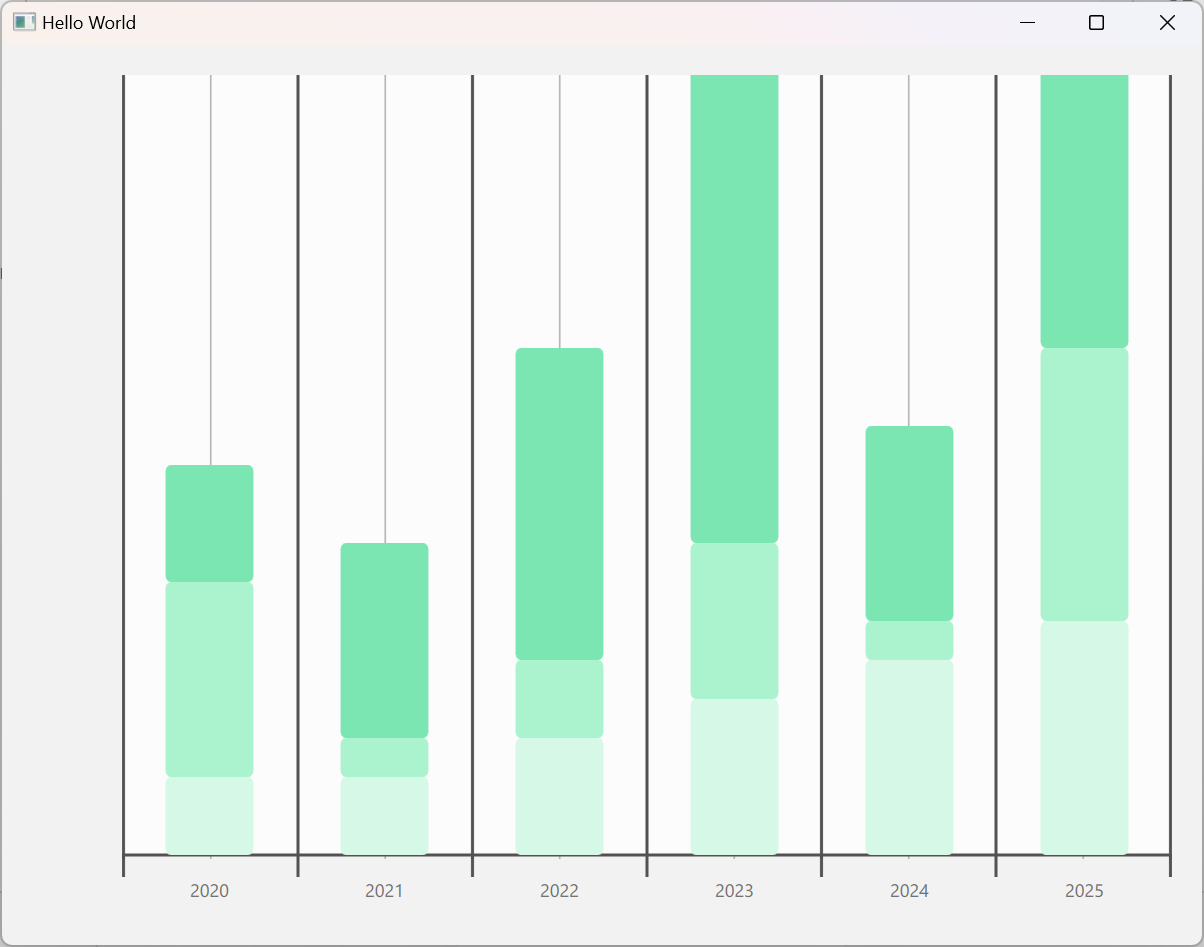
The problem is that series1 completely overlaps with series 0. "Overlapping" may make sense to, e.g. LineSeries, but it is definitely confusing for BarSeries.
Temporary workaround: sophisticated barDelegate. Something like:
    Component {
        id: barDelegateComp0

        Item {
            id: comp
            property color barColor
            property real barValue
            property int barIndex
            property string barLabel

            property int spacing: 0

            Rectangle {
                color: comp.barColor
                border.color: "#000000"
                width: parent.width / 2 - comp.spacing
                height: parent.height
                x: 0

                Text {
                    rotation: -90
                    anchors.centerIn: parent
                    text: comp.barLabel
                }
            }
        }
    }

    Component {
        id: barDelegateComp1

        Item {
            id: comp
            property color barColor
            property real barValue
            property int barIndex
            property string barLabel

            property int spacing: 0

            Rectangle {
                color: comp.barColor
                border.color: "#000000"
                width: parent.width / 2 - comp.spacing
                height: parent.height
                x: parent.width / 2 + comp.spacing

                Text {
                    rotation: -90
                    anchors.centerIn: parent
                    text: comp.barLabel
                }
            }

        }
    }

    GraphsView {
        id: graphsView
        anchors.fill: parent
        axisX: bar

        BarCategoryAxis {
            id: bar
            categories: ["2020", "2021", "2022", "2023", "2024", "2025"]
        }

        BarSeries {
            id: series0
            barsType: BarSeries.BarsType.Stacked
            barDelegate: barDelegateComp0

            BarSet {
                label: "Alice"
                values: [2, 2, 3, 4, 5, 6]
            }

            BarSet {
                label: "Bob"
                values: [5, 1, 2, 4, 1, 7]
            }

            BarSet {
                label: "Carol"
                values: [3, 5, 8, 13, 5, 8]
            }
        }

        BarSeries {
            id: series1
            barsType: BarSeries.BarsType.Stacked
            barDelegate: barDelegateComp1

            BarSet {
                label: "Carol"
                values: [2, 2, 3, 4, 5, 6]
            }

            BarSet {
                label: "Bob"
                values: [5, 1, 2, 4, 1, 7]
            }

            BarSet {
                label: "Trent"
                values: [3, 5, 8, 13, 5, 8]
            }
        }
    }
And that is the complexity user has to work with when there are just 2 series instances.