-
Bug
-
Resolution: Fixed
-
 P3: Somewhat important
-
6.8.3, 6.9.1
-
None
-
Linux/X11,
Windows
-
52c5d1d3e (dev), c0829ec48 (6.10), a9b1b878e (6.9), 517efad87 (tqtc/lts-6.8)
Using 2D GraphsView with AreaSeries, produces some inconsistent area filling in some cases.
Using only the UpperSeries, and Y value in the positive interval the area is not filled for the first part, when starting point is in Y = 0.
Check following example:
GraphsView {
  id: graphsView
  anchors.fill: parent  axisY: ValueAxis {
    min: 0
    max: 2
    tickInterval: 1
    subTickCount: 0
  }  axisX: ValueAxis {
    min: -60
    max: 60
  }  AreaSeries {
    color: "red"
    borderColor: "blue"
    borderWidth: 3
    upperSeries: LineSeries {
      XYPoint {x: -20; y: 0 }
      XYPoint {x: 0; y: 0 }
      XYPoint {x: 0; y: 1 }
      XYPoint {x: 10; y: 1 }
      XYPoint {x: 10; y: 0 }
      XYPoint {x: 15; y: 0 }
      XYPoint {x: 15; y: 1 }
      XYPoint {x: 20; y: 1 }
      XYPoint {x: 20; y: 0 }
      XYPoint {x: 25; y: 0 }
    }
  }
}
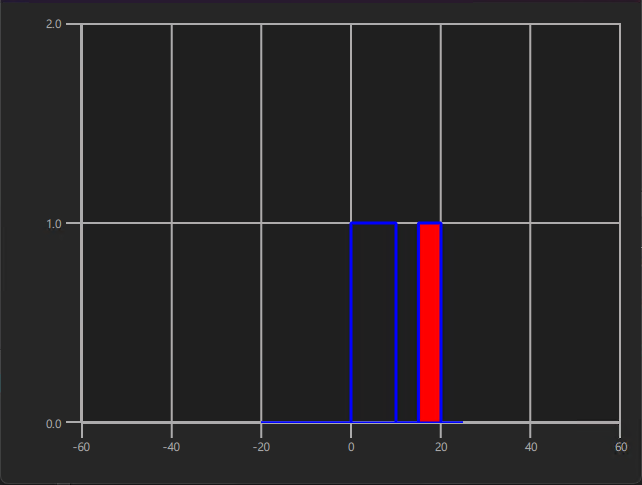
This produces the following graph

The area between (0,0) and (15,1) is not filled, even though the LineSeries border is present.
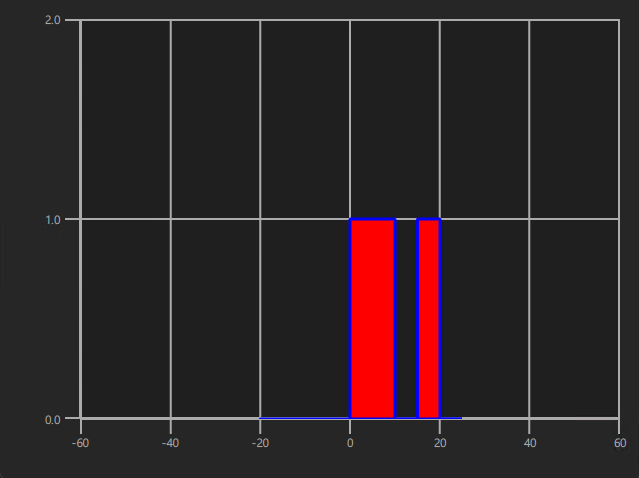
One workaround for this issue is changing the first element's Y coordinates to something non 0.
Change: {{XYPoint {x: -20; y: 0 }}} -> {{XYPoint {x: -20; y: -1 }}} and the graph will look ok:

| For Gerrit Dashboard: QTBUG-139112 | ||||||
|---|---|---|---|---|---|---|
| # | Subject | Branch | Project | Status | CR | V |
| 669638,3 | Prevent improper fill for area series on the zero-axis | dev | qt/qtgraphs | Status: MERGED | +2 | 0 |
| 673398,2 | Prevent improper fill for area series on the zero-axis | 6.10 | qt/qtgraphs | Status: MERGED | +2 | 0 |
| 673492,4 | Prevent improper fill for area series on the zero-axis | 6.9 | qt/qtgraphs | Status: MERGED | +2 | 0 |
| 675520,3 | Prevent improper fill for area series on the zero-axis | tqtc/lts-6.8 | qt/tqtc-qtgraphs | Status: MERGED | +2 | 0 |