-
Bug
-
Resolution: Unresolved
-
 P1: Critical
-
None
-
6.8.4, 6.10.0 Beta2
-
Pre-built Boot to Qt on Raspberry Pi 4; Windows 10 22H2, Intel Core i7-7700
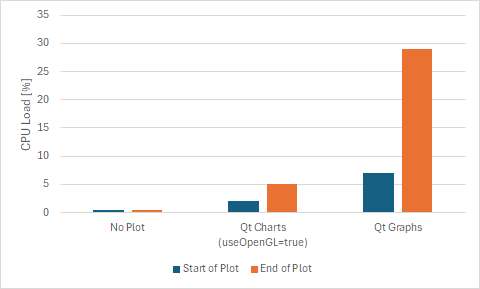
The attached project is set up to compare Qt Charts vs. Qt Graphs.
Steps to test
- Build and run the attached project
- Use `top` to monitor the app's CPU load while the line is being painted. Keep monitoring as the plot is filled + cleared a few times.
- Set the Plot Type to "No Plot" to see the app's background CPU load
- Repeat the test after changing "Graphs" to "Charts" (under the "Compile-time configuration" section in CMakeLists.txt)
Results
These are the numbers on the pre-built Boot to Qt 6.8.4 on Raspberry Pi 4, when updating the plot every 250ms (with 50 points appended per update, up to a total of 5000 points):

Notes:
- In "No Plot" mode, the QList<QPointF>s are still being modifed. We only omit the call to QXYSeries::append().
- "Start of Plot" is when the LineSeries is almost empty
- "End of Plot" is when the LineSeries is almost full
- Similar trends can be seen on Windows 10 (Intel HD Graphics 630 GPU), by increasing the number of samples and decreasing the update interval
| For Gerrit Dashboard: QTBUG-139252 | ||||||
|---|---|---|---|---|---|---|
| # | Subject | Branch | Project | Status | CR | V |
| 683357,3 | Curver renderer stroke optimizations | dev | qt/qtdeclarative | Status: NEW | 0 | 0 |
| 683358,3 | Curver renderer fill optimizations | dev | qt/qtdeclarative | Status: NEW | 0 | 0 |
| 683359,3 | Optimize QSGCurveProcessor::processStroke | dev | qt/qtdeclarative | Status: NEW | 0 | 0 |
| 683360,2 | Optimize vertex appending | dev | qt/qtdeclarative | Status: ABANDONED | 0 | 0 |