-
Bug
-
Resolution: Duplicate
-
P2: Important
-
5.7.1
-
None
-
Linux Red Hat 6
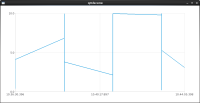
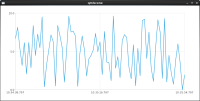
When using a DateTimeAxis in a Qml ChartView and a LineSeries set to useOpenGL = true, then the x positions in the line serie are drawn in slots about every second minute.
Try this example and run with qmlscene.
import QtQuick 2.7
import QtCharts 2.1

ChartView {
    id: chart
    width: 600
    height: 400
    legend.visible: false
    antialiasing: true

    ValueAxis {
        id: yaxis
        tickCount: 3
        min: 0
        max: 10
    }

    DateTimeAxis {
        id: xaxis
        format: "HH:mm:ss:zzz"
        tickCount: 3
    }

    LineSeries {
        id: dataSeries
        axisX: xaxis
        axisY: yaxis
        useOpenGL: false
    }

    Timer {
        running: true
        interval: 1000
        repeat: true

        onTriggered: {
            var now = new Date()
            if (dataSeries.count === 0) {
                xaxis.min = now;
            }
            xaxis.max = now

            dataSeries.append(now.getTime(), Math.random() * 10)
        }
    }
}
The result when running with useOpenGL true/false is shown in the two attachments.
Same problem has been mentioned here https://forum.qt.io/topic/69532/qt-charts-2-1-problem-with-datetimeaxis.

