Uploaded image for project: 'Qt'
  1. Qt
  2. QTBUG-67323

HTML5 canvas charts not rendered using WebEngine

    XMLWordPrintable

Details

    • Bug
    • Resolution: Cannot Reproduce
    • P2: Important
    • None
    • 5.10.1
    • WebEngine
    • None
    • Linux/X11

    Description

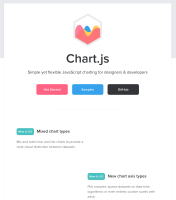
      The graphs on sites like http://www.chartjs.org or home-assistant websites utilizing this library.

      I have tried multiple browsers based on QWebEngine:

      • qutebrowser
      • falkon

      It works with chromium, but not the ones above. Using qutebrowser or falkon and hovering above the all white canvas area, hints will eventually popup of a data point.

      When unsetting:

      • QT_DEVICE_PIXEL_RATIO
      • QT_AUTO_SCREEN_SCALE_FACTOR{{}}

      It eventually worked with qutebrowser.


      Qt 5.10.1 (x86_64-little_endian-lp64 shared (dynamic) release build; by GCC 7.3.1 20180312) on "xcb"
      OS: Arch Linux [linux version 4.15.12-1-ARCH]

      Architecture: x86_64; features: SSE2 SSE3 SSSE3 SSE4.1 SSE4.2 AVX AVX2

      Environment:
      QT_AUTO_SCREEN_SCALE_FACTOR="0.4"
      QT_STYLE_OVERRIDE="GTK+"
       

      Attachments

        1. qute.pdf
          1.04 MB
        2. qute_temp_basedir.pdf
          1.04 MB
        3. chromium.pdf
          96 kB
        4. chartjs_bug.png
          chartjs_bug.png
          83 kB
        No reviews matched the request. Check your Options in the drop-down menu of this sections header.

        Activity

          People

            qt_webengine_team Qt WebEngine Team
            jaypikay Julian Knauer
            Votes:
            0 Vote for this issue
            Watchers:
            7 Start watching this issue

            Dates

              Created:
              Updated:
              Resolved:

              Gerrit Reviews

                There are no open Gerrit changes