-
Bug
-
Resolution: Unresolved
-
 P2: Important
-
None
-
5.12.4
-
None
-
QMake version 3.1
Using Qt version 5.12.4
gcc-9 9.1.0
-
Linux/X11
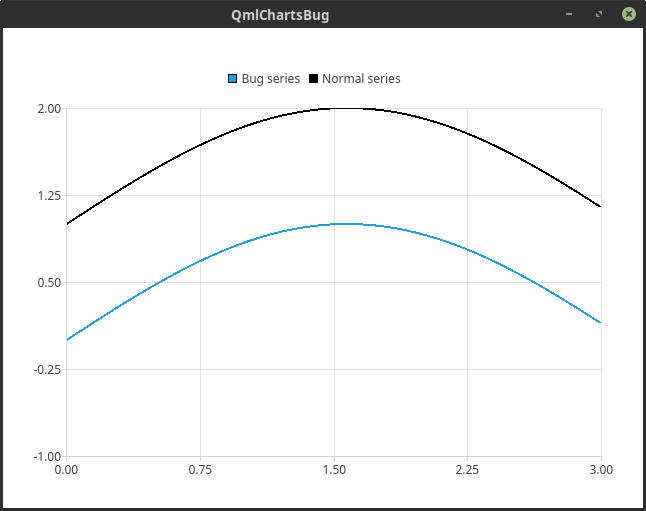
import QtQuick 2.12
import QtQuick.Window 2.12
import QtCharts 2.3

Window {
    visible: true
    width: 640
    height: 480

    ChartView {
        anchors.fill: parent
        ValueAxis {
            id: xAxis
            min: 0
            max: 3
        }
        ValueAxis {
            id: yAxis
            min: -1
            max: 2
        }

        LineSeries {
            id: bugSeries
            axisX: xAxis
            axisY: yAxis
            color: "black" // [1] set black color to series
            width: 1 // [2] set value 1 to width
            // this series has default color on plot
            name: "Bug series"
        }

        LineSeries {
            id: normalSeries
            axisX: xAxis
            axisY: yAxis
            color: "black" // [3] set black color to series
            width: 2 // [4] set value 2 to width
            // this series has black color on plot
            name: "Normal series"
        }

        Component.onCompleted: {
            for (var i = 0; i < 300; ++i)
            {
                var x = i / 100
                var y = Math.sin(x)
                bugSeries.append(x, y)
                normalSeries.append(x, y+1)
            }
        }
    }
}
Expected:
bugSeries has setted "black" color.
Actual:
If width of LiseSeries equals default value or 1 then LineSeries ignore setted value to property "color" and has default color.
bugSeries has width value equals 1 and default color, normalSeries has setted "black" color.