Uploaded image for project: 'Qt'
  1. Qt
  2. QTBUG-80469

ChartView: Axis min/max change after one of series is moved to another axis

    XMLWordPrintable

Details

    • Bug
    • Resolution: Unresolved
    • P2: Important
    • None
    • 5.12.1
    • Charts
    • None
    • Windows

    Description

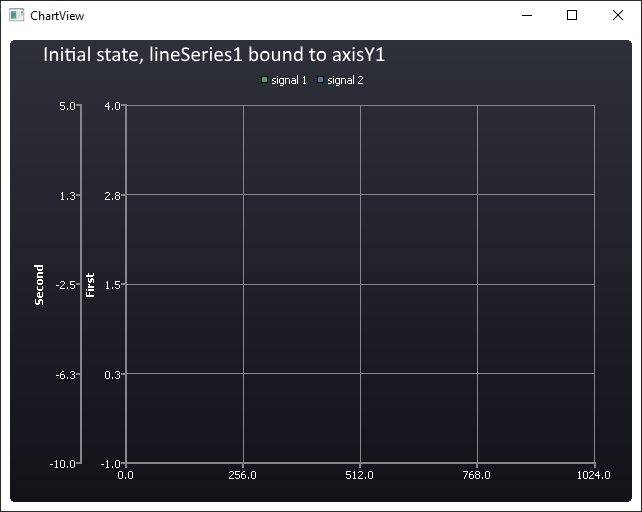
      import QtQuick 2.12
      import QtQuick.Controls 2.12
      import QtQuick.Window 2.12
      import QtCharts 2.3
      
      ApplicationWindow {
          visible: true
          width: 640
          height: 480
          title: qsTr("ChartView")
          property int toggleAxis: 0
      
          ChartView {
              id: chartView
              anchors.fill: parent
              animationOptions: ChartView.NoAnimation
              theme: ChartView.ChartThemeDark
      
      
              MouseArea{
                  anchors.fill: parent;
                  onClicked: {
                      switch(toggleAxis){
                      case 0:
                          toggleAxis++;
                          chartView.setAxisY(axisY2, lineSeries1);
                          break;
      
                      case 1:
                          toggleAxis++;
                          chartView.setAxisY(axisY3, lineSeries1);
                          break;
                      }
                  }
              }
      
              ValueAxis {
                  id: axisY1
                  titleText: "First"
                  min: -1
                  max: 4
              }
      
              ValueAxis {
                  id: axisY2
                  titleText: "Second"
                  min: -10
                  max: 5
              }
      
              ValueAxis {
                  id: axisY3
                  titleText: "Third"
                  min: -99
                  max: 99
              }
      
              ValueAxis {
                  id: axisX
                  min: 0
                  max: 1024
              }
      
              LineSeries {
                  id: lineSeries1
                  name: "signal 1"
                  axisX: axisX
                  axisY: axisY1
              }
              LineSeries {
                  id: lineSeries2
                  name: "signal 2"
                  axisX: axisX
                  axisY: axisY2
              }
          }
      }
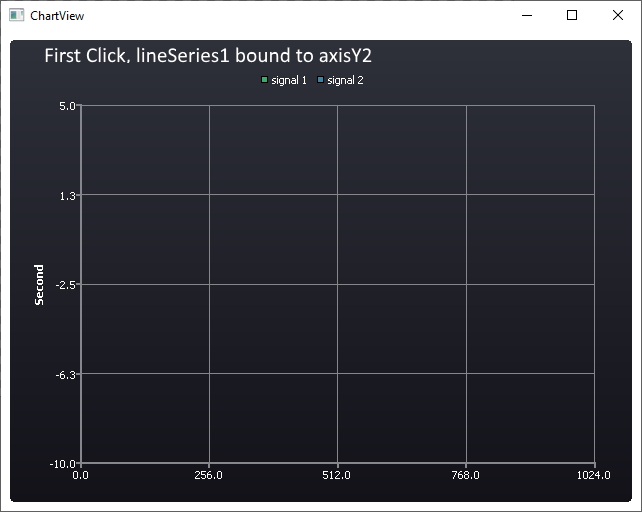
      

      Expected:

      On second click

      lineSeries1 is set to axisY3, axisY3.name == "Third", axisY3.min == -99, axisY3.max == 99

      and lineSeries2 is set to axisY2, axisY2.name == "Second", axisY2.min = -10 and axisY2.max = 5
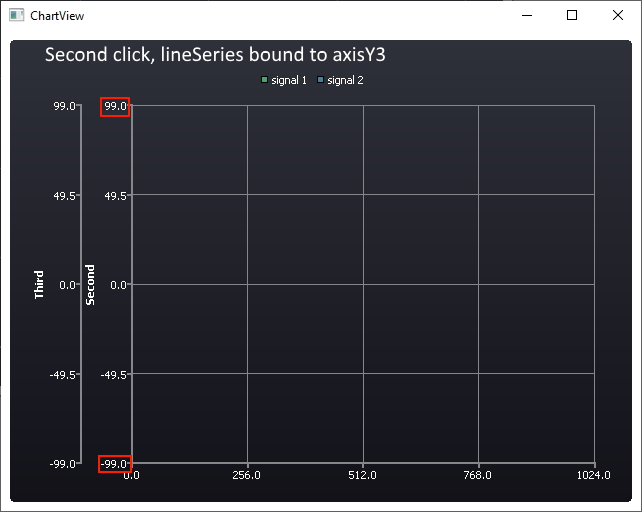
       

      Actual:

      On second click

      lineSeries2 is set to axisY2, axisY2.name == "Second", axisY2.min = -99 and axisY2.max = 99

      Attachments

        1. First.jpg
          First.jpg
          77 kB
        2. Initial.jpg
          Initial.jpg
          80 kB
        3. Second.jpg
          Second.jpg
          84 kB
        No reviews matched the request. Check your Options in the drop-down menu of this sections header.

        Activity

          People

            e0348803 Miikka Heikkinen
            pavloponomarov pavloponomarov
            Votes:
            0 Vote for this issue
            Watchers:
            1 Start watching this issue

            Dates

              Created:
              Updated:

              Gerrit Reviews

                There are no open Gerrit changes