- Create a QML project
- Add widgets to Qt in .pro file ( mine is QT += quick widgets )
- Switch to QApplication from QGuiApplication in main.cpp
- Add ChartView
- Set legend.markerShape to Legend.MarkerShapeFromSeries
- Add a BarSeries with multiple BarSet elements
- Add a LineSeries
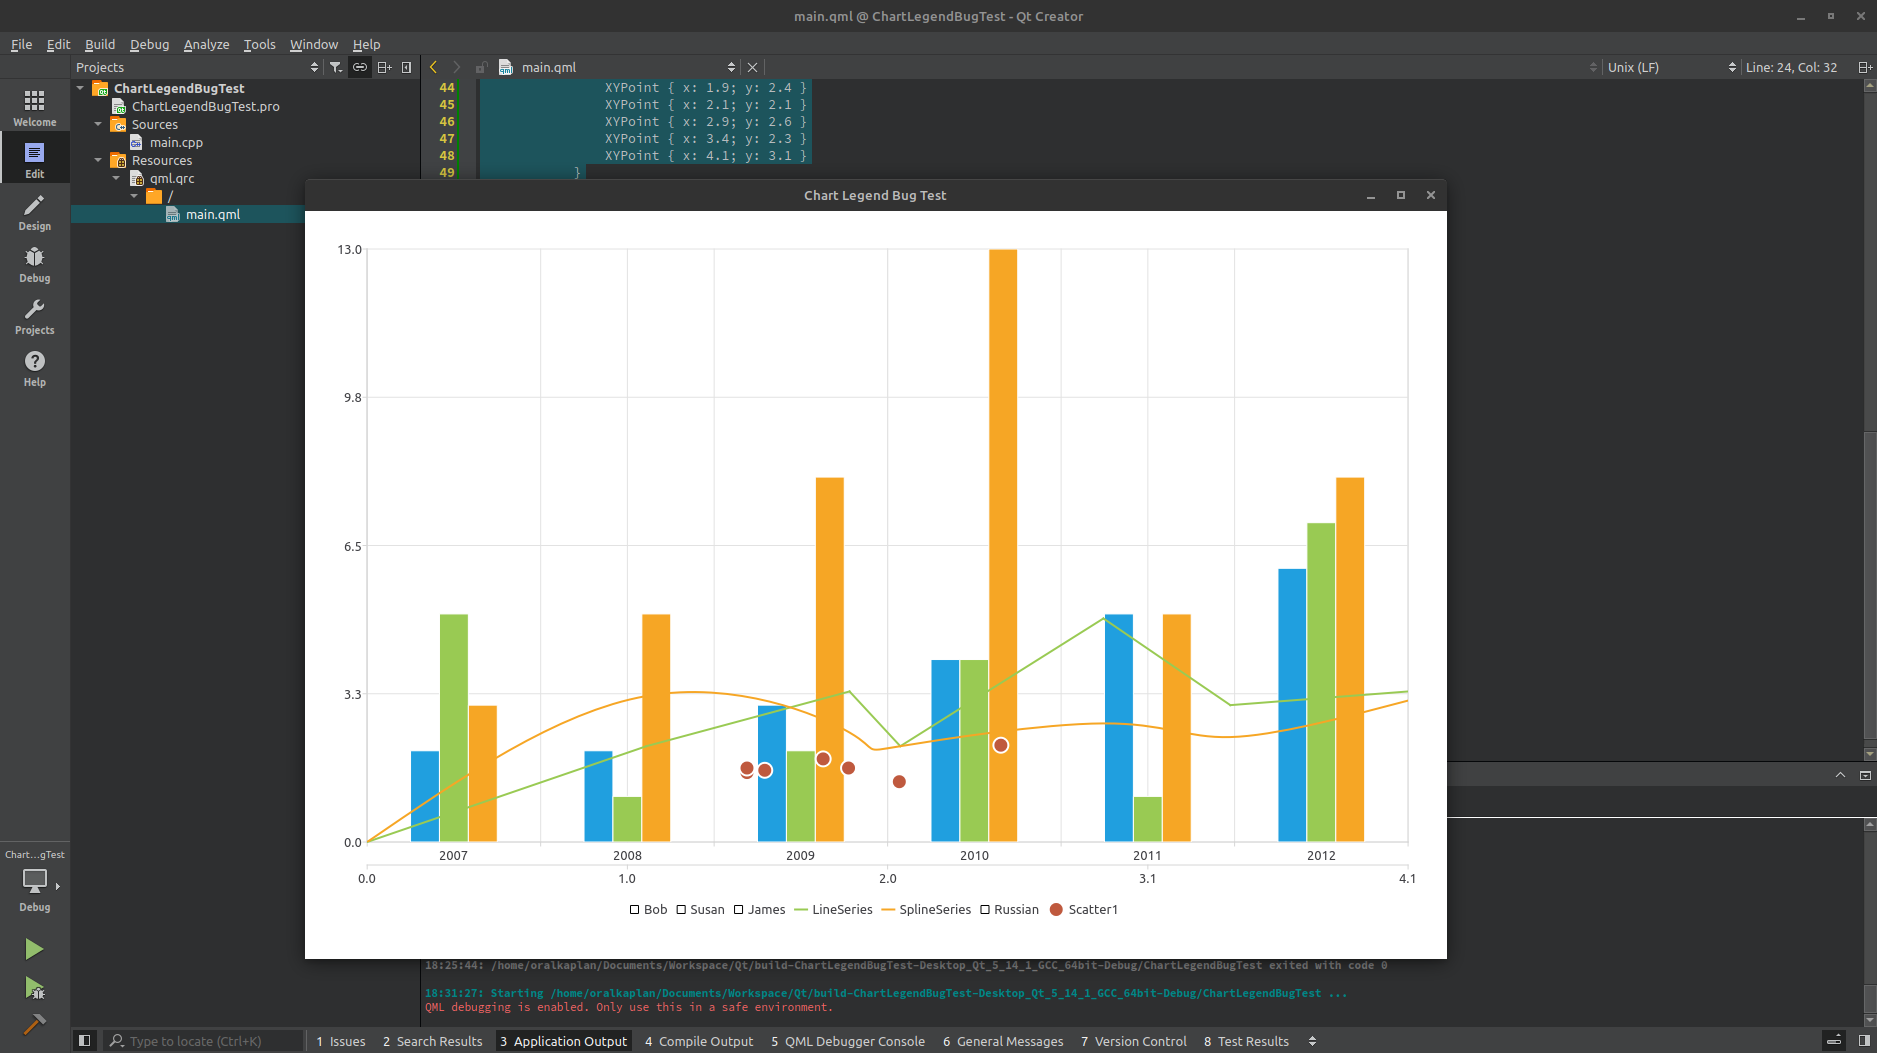
- Run
Lines and scatters are fine, but rectangle fill color seems transparent ( tried with gray background too and the result is gray )
Following is the code I tried. It is a compilation of examples.
import QtQuick 2.12
import QtQuick.Controls 2.12
import QtQuick.Window 2.12
import QtCharts 2.3

ApplicationWindow {
    visible: true
    width: 640
    height: 480
    title: qsTr("Chart Legend Bug Test")

Item {
        anchors.fill: parent

ChartView {
            anchors.fill: parent
            legend.alignment: Qt.AlignBottom
            legend.markerShape: Legend.MarkerShapeFromSeries
            antialiasing: true

BarSeries {
                id: mySeries
                axisX: BarCategoryAxis { categories: ["2007", "2008", "2009", "2010", "2011", "2012" ] }
                BarSet { label: "Bob"; values: [2, 2, 3, 4, 5, 6] }
                BarSet { label: "Susan"; values: [5, 1, 2, 4, 1, 7] }
                BarSet { label: "James"; values: [3, 5, 8, 13, 5, 8] }
            }

LineSeries {
                name: "LineSeries"
                XYPoint { x: 0; y: 0 }
                XYPoint { x: 1.1; y: 2.1 }
                XYPoint { x: 1.9; y: 3.3 }
                XYPoint { x: 2.1; y: 2.1 }
                XYPoint { x: 2.9; y: 4.9 }
                XYPoint { x: 3.4; y: 3.0 }
                XYPoint { x: 4.1; y: 3.3 }
            }

SplineSeries {
                name: "SplineSeries"
                XYPoint { x: 0; y: 0.0 }
                XYPoint { x: 1.1; y: 3.2 }
                XYPoint { x: 1.9; y: 2.4 }
                XYPoint { x: 2.1; y: 2.1 }
                XYPoint { x: 2.9; y: 2.6 }
                XYPoint { x: 3.4; y: 2.3 }
                XYPoint { x: 4.1; y: 3.1 }
            }

AreaSeries {
                name: "Russian"
                upperSeries: LineSeries {
                    XYPoint { x: 2000; y: 1 }
                    XYPoint { x: 2001; y: 1 }
                    XYPoint { x: 2002; y: 1 }
                    XYPoint { x: 2003; y: 1 }
                    XYPoint { x: 2004; y: 1 }
                    XYPoint { x: 2005; y: 0 }
                    XYPoint { x: 2006; y: 1 }
                    XYPoint { x: 2007; y: 1 }
                    XYPoint { x: 2008; y: 4 }
                    XYPoint { x: 2009; y: 3 }
                    XYPoint { x: 2010; y: 2 }
                    XYPoint { x: 2011; y: 1 }
                }
            }

ScatterSeries {
                id: scatter1
                name: "Scatter1"
                XYPoint { x: 1.5; y: 1.5 }
                XYPoint { x: 1.5; y: 1.6 }
                XYPoint { x: 1.57; y: 1.55 }
                XYPoint { x: 1.8; y: 1.8 }
                XYPoint { x: 1.9; y: 1.6 }
                XYPoint { x: 2.1; y: 1.3 }
                XYPoint { x: 2.5; y: 2.1 }
            }
        }
    }
}
I am also experiencing the same behavior in my own project; which contains three barsets and a line series in a single chart view.
__