Uploaded image for project: 'Qt'
  1. Qt
  2. QTBUG-89443

Feature Request: Allow for More Markers Shapes in Plots

XMLWordPrintable

    • Icon: Suggestion Suggestion
    • Resolution: Fixed
    • Icon: Not Evaluated Not Evaluated
    • 6.2.0
    • 5.12.3
    • Charts

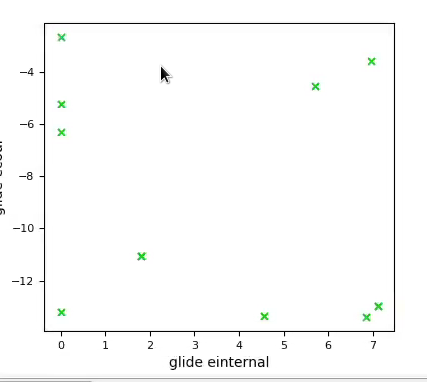
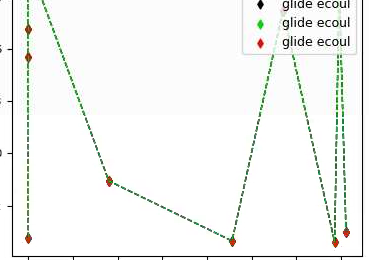
      Currently, the plots markers can only be a colored rectangle or a colored circle. It would be good to have more shapes. matplotlib provides such ability.

        1. cross shape.png
          22 kB
          Vipin Jain
        2. Diamond shape.png
          58 kB
          Vipin Jain
        For Gerrit Dashboard: QTBUG-89443
        # Subject Branch Project Status CR V

            e0348803 Miikka Heikkinen
            vipinjain Vipin Jain
            Votes:
            1 Vote for this issue
            Watchers:
            4 Start watching this issue

              Created:
              Updated:
              Resolved:

                There are no open Gerrit changes