-
Suggestion
-
Resolution: Unresolved
-
 P3: Somewhat important
-
None
-
5.15.2
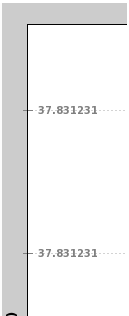
There is no way to make the ticks of a ValueAxis render on a ChartView's grid lines in the plot area and to have tick marks on axis. Please refer to the snapshot.
It would be better to have such an option to place tick labels on the left / right side of the Y-axis. And similarly, up/down for XAxis. And it would be great if the user can have tick marks also, meaning small perpendicular lines on Axis.