-
Bug
-
Resolution: Done
-
 P1: Critical
-
5.15.5, 6.1.2
-
Win 10, MSVC2019
-
4b056cf30d5870f73ec467a963fcaaa6ec6fab46 (qt/qtcharts/dev) 49f0741a2d4c2387b924ef09ff0a25075728a66f (qt/qtcharts/6.1) cd24c65966db0398b17526560f75b258a6cf5952 (qt/qtcharts/6.2) 5e97554bdd41d7bbdf4c5386cd0ccdb3d4d519ff (qt/tqtc-qtcharts/5.15)
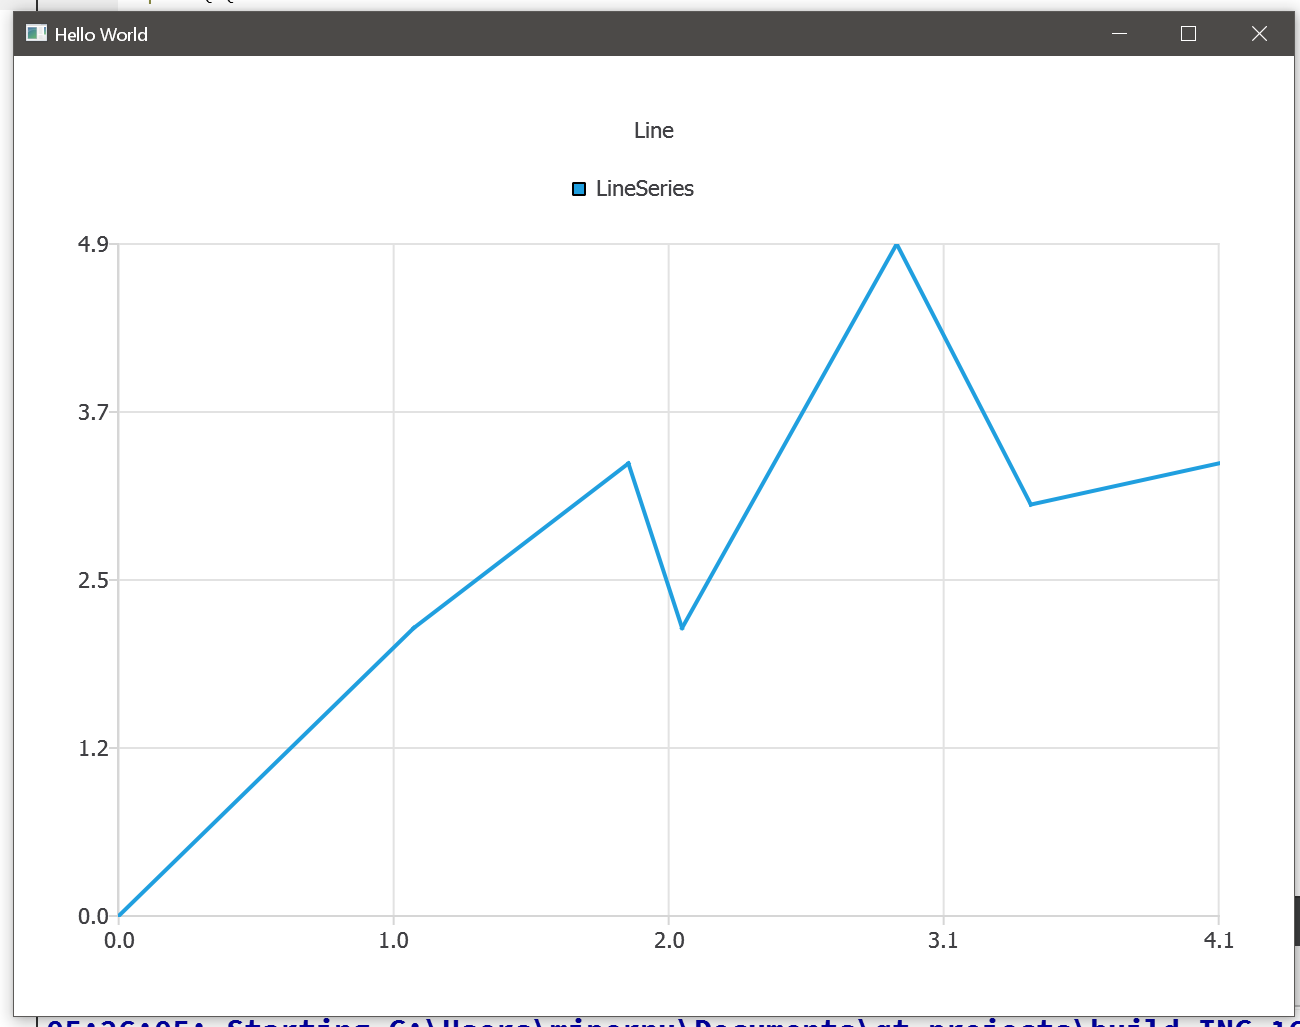
Some axis labels are missing from both vertical and horizontal axes even in simple examples. The problem did not exist in 5.15.4.
Steps to reproduce the problem:
- Run the attached example
EDIT by jimis:
The X axis label disappearing is because of this check in horizontalaxis.cpp, function HorizontalAxis::updateGeometry():
        // Label overlap detection - compensate one pixel for rounding errors.
        // This is not needed for color axis as its labels don't collide with other labels
        if ((labelItem->pos().x() < last_label_max_x && labelItem->toPlainText() == ellipsis)
            || forceHide
            || (labelItem->pos().x() + (widthDiff / 2.0))       < (axisRect.left() - 1.0)    // This test comes out true!!!
            || (labelItem->pos().x() + (widthDiff / 2.0) - 1.0) > axisRect.right()) {
            if (axis()->type() != QAbstractAxis::AxisTypeColor)
                labelItem->setVisible(false);
        } else {
            labelItem->setVisible(true);
            last_label_max_x = boundingRect.width() + labelItem->pos().x();
        }

- resulted from
-
-

- In Progress
-
| For Gerrit Dashboard: QTBUG-94998 | ||||||
|---|---|---|---|---|---|---|
| # | Subject | Branch | Project | Status | CR | V |
| 365319,7 | Fix X axis labels drawing over each other | dev | qt/qtcharts | Status: NEW | 0 | 0 |