-
Bug
-
Resolution: Done
-
 P2: Important
-
5.15
-
17bd07cbc5 (qt/qtdeclarative/dev) 17bd07cbc5 (qt/tqtc-qtdeclarative/dev)
Hello,
I am trying to improve performance of the QML scripts in my app.
While looking at traces, there is something that seems pretty weird to me.
I have the following code in QML:
      for(let s = 0; s < n; s++) {
        let sample =  /* some small computation, e.g. Math.sin */;
        out1.setSample(0, s, sample);
        out1.setSample(1, s, sample);
      }
out1 is a C++ QObject with the following slot:
    void setSample(int i, int j, double v)
    {
      // c is a std::vector<std::vector<double>>
      c[i][j] = v;
    }
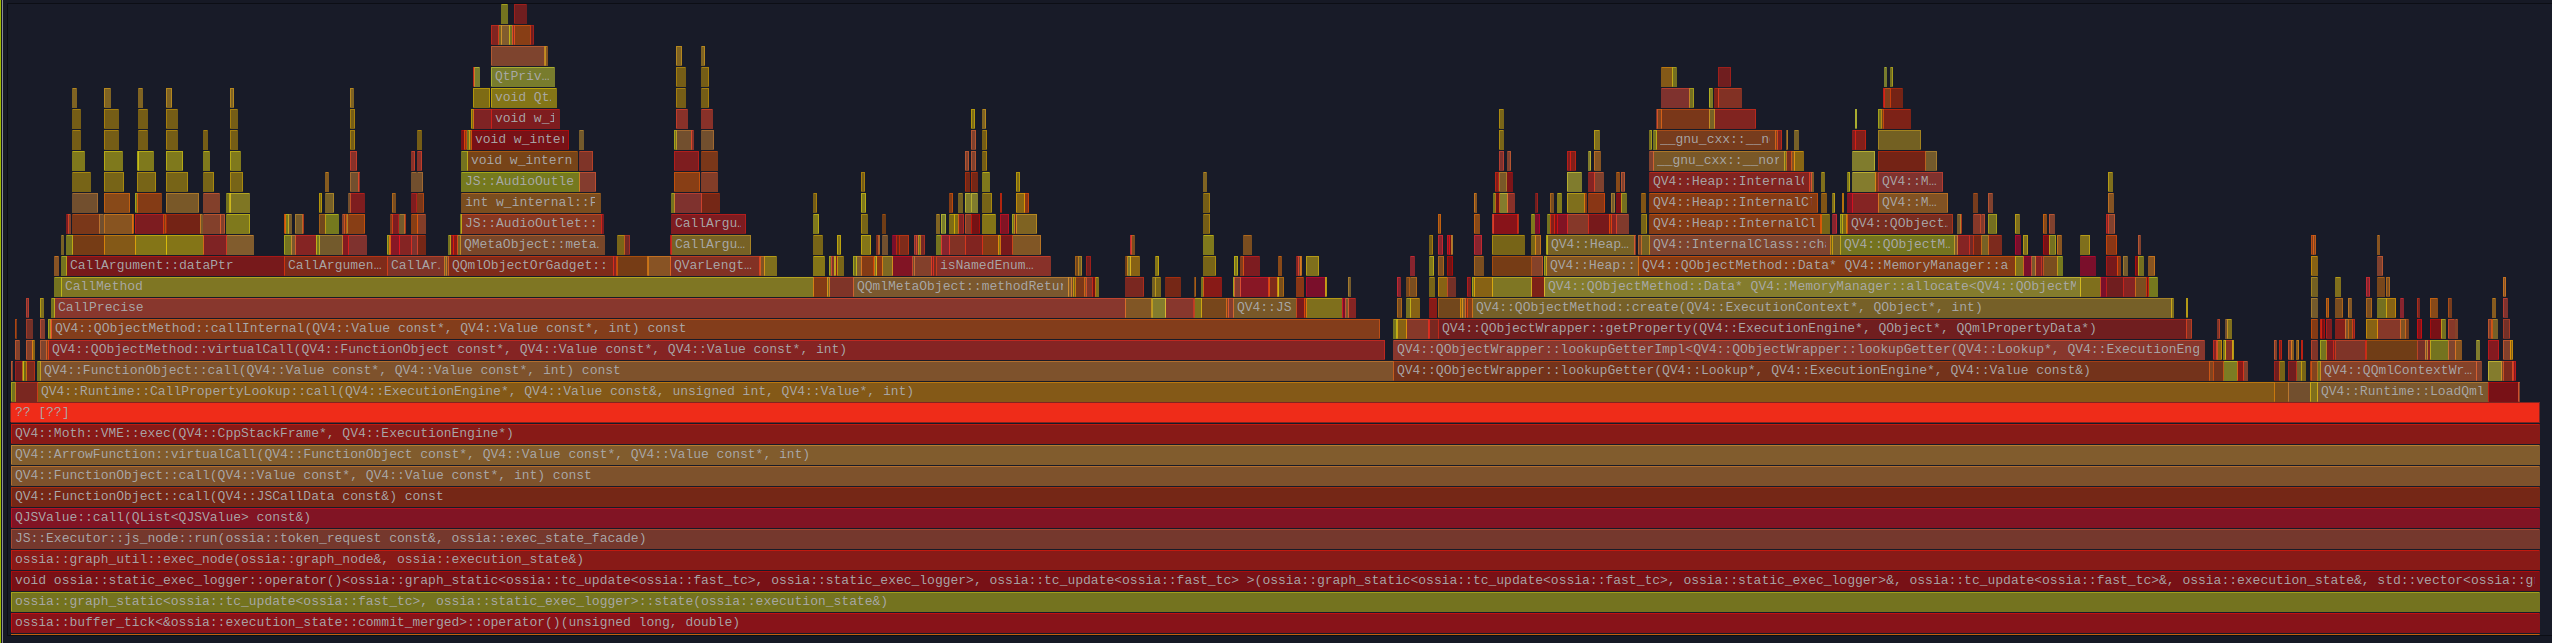
when I look at the trace, I notice that every time setSample is called, there's a loong call to QV4::QObjectMethod::create which seems to do a lot of stuff, and allocate a lot of memory.
Like, all in all, my actual c++ method call, visible at the left (JS::AudioOutlet::...) is 1% of the total of the call... and I'm in a debug build !
Is this 100x performance penalty a fact of life of QML which cannot be avoided ? Is there some missed optimization / caching opportunity lost here ? (e.g. I'd assume something like a per-metaobject method cache?)
| For Gerrit Dashboard: QTBUG-95628 | ||||||
|---|---|---|---|---|---|---|
| # | Subject | Branch | Project | Status | CR | V |
| 363611,2 | WIP: More efficient method lookup | dev | qt/qtdeclarative | Status: NEW | -2 | 0 |
| 432685,4 | WIP: Decouple QObject(Meta)Method from actual object | dev | qt/qtdeclarative | Status: ABANDONED | -2 | 0 |
| 433212,16 | QML: Optimize QObject method calls | dev | qt/qtdeclarative | Status: MERGED | +2 | 0 |