-
Bug
-
Resolution: Duplicate
-
 P2: Important
-
None
-
5.15.5, 6.1.2
-
Windows
Top value on Y axis and min value on X axis have disappeared in QtCharts application between Qt versions 5.15.4 and 5.15.5. This is affecting the Qt 6.1.2 as well.
Way to reproduce:
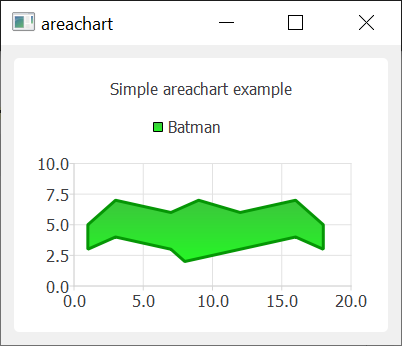
1) Build and run the Qt charts example areachart with Qt 5.15.4
2) The Top value on Y axis and the min value on X axis are visible. (Please see the 5_15_4_values_visible.png.)
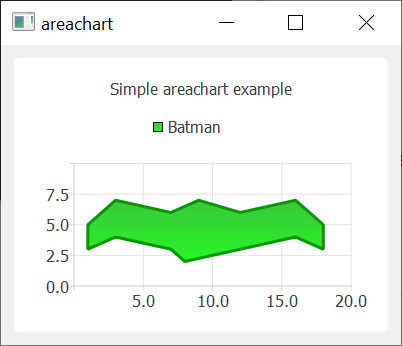
3) Build and run the Qt charts example areachart with Qt 5.15.5
4) The Top value on Y axis and the min value on X axis are missing. (Please see the 5_15_5_values_missing.png.)
This is due to commit:
9aacc8367dff20f559689dd5245049b7b1fb161f
which fixed the qtbug-79218:
https://bugreports.qt.io/browse/QTBUG-79218