-
 Technical task
-
Resolution: Done
-
 Not Evaluated
-
None
-
Windows
-
6d31e42632f0779212b2a265f3c9a7c97a0e63b0 (qt/qtdatavis3d/dev)
Actually the only way to allow the user to select a specific color for a row is to generate a QBars3DSerie with empty rows but one at the index where user data should be displayed, and then to call QBars3DSeries::setBaseColor().
It works perfectly (even if it’s a lot of user code just to change a color), but even when rows are totally independent (ie, there is never multiple bars per cell), Bars3D reserves some space left for hidden rows resulting in an “alignment offset” that is hard to interpret for final users.
The use case is probably very common, for example if you are working with value over time data, where datetime are columns and data series are rows (which is the case of most demonstration samples).
Would it be possible to add an ‘independent’ property to QBars3DSeries, so that the renderer could avoid drawing that kind of artifacts ?
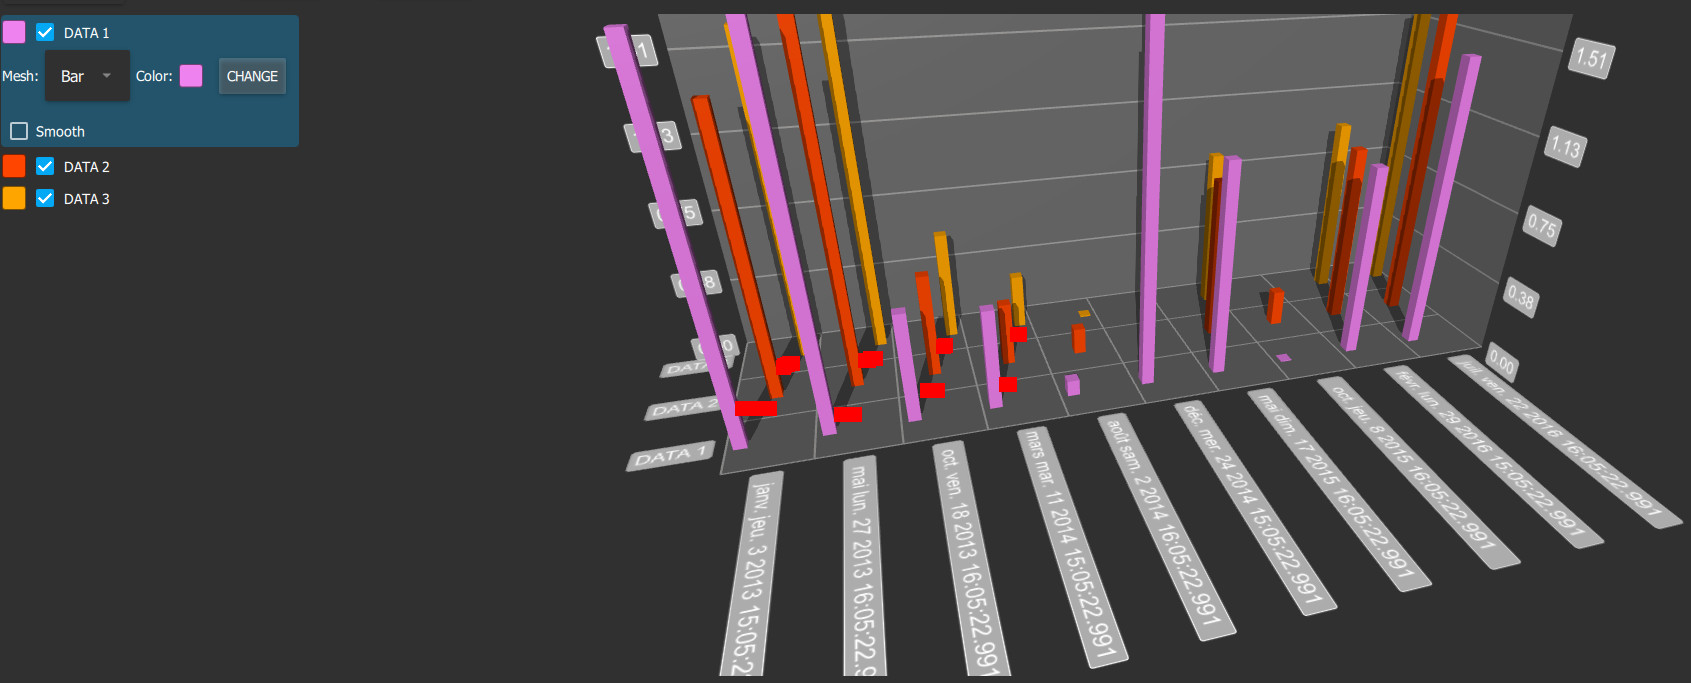
Example: Values for three series with independent rows not aligned in row axis, space for 2 undrawn bar is left in all cells (in red):
(artifact highlighted in red)