Uploaded image for project: 'Qt'
  1. Qt
  2. QTBUG-96691

No axis labels when the range in QLogValueAxis is smaller than power of 10

XMLWordPrintable

    • Icon: Suggestion Suggestion
    • Resolution: Won't Do
    • Icon: P2: Important P2: Important
    • None
    • 5.15.6, 6.4.0
    • Charts

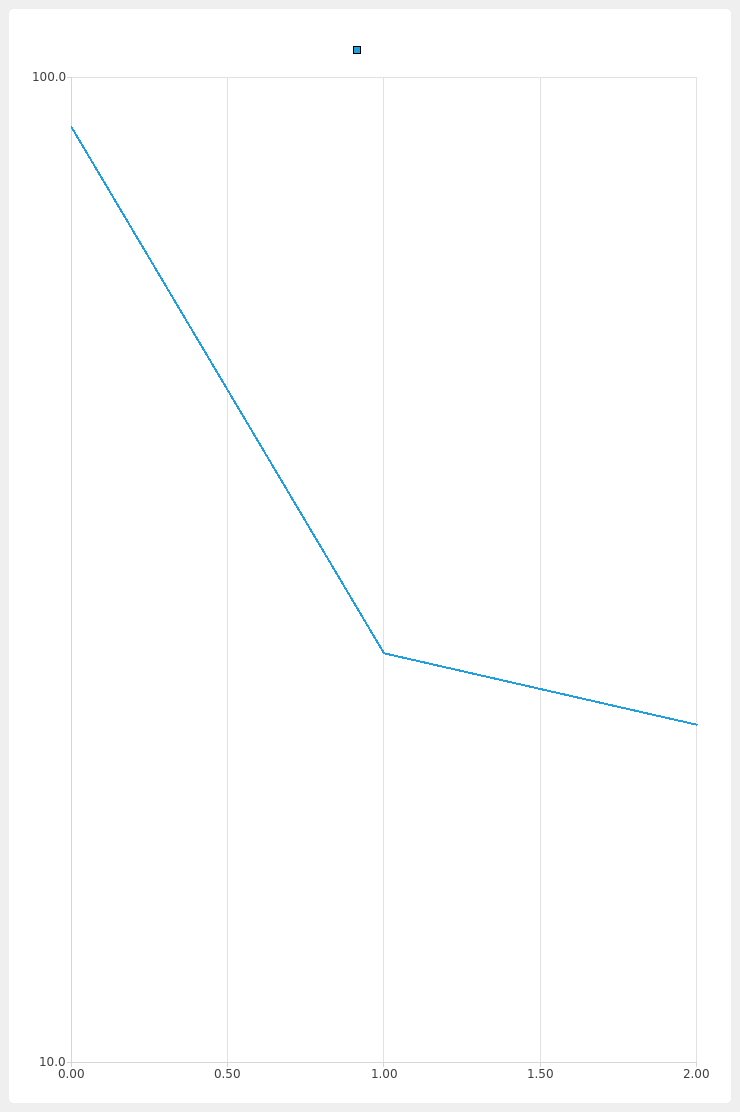
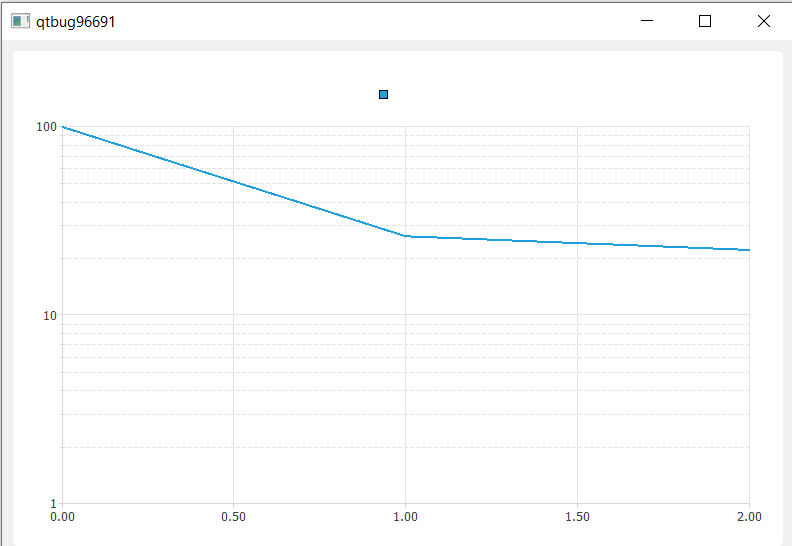
      No labels are shown if all values fit within one power of 10 level. To reproduce, run attached example.

        1. qtbug96691.zip
          0.8 kB
        2. qtbug96691.png
          qtbug96691.png
          12 kB
        3. qtbug96691_log.txt
          3 kB
        4. qtbug96691_diag.diff
          7 kB
        5. qtbug96691_1.zip
          1 kB
        6. image-2021-10-12-15-10-18-637.png
          image-2021-10-12-15-10-18-637.png
          21 kB
        No reviews matched the request. Check your Options in the drop-down menu of this sections header.

            e0150566 Janne Roine
            poikelin Joni Poikelin
            Votes:
            0 Vote for this issue
            Watchers:
            4 Start watching this issue

              Created:
              Updated:
              Resolved:

                There are no open Gerrit changes