-
Bug
-
Resolution: Unresolved
-
 P3: Somewhat important
-
None
-
5.15.0
-
None
-
Linux/X11
When dynamically adding series to a ChartView component, setting an axisYRight to one of the series affects also the axisY shown on the chart. In fact it doesn't matter if the axis is Right or Left, but the last one added imposes it's 'min' and 'max' values to all the vertical axis on the chart. It doesn't seem to affect other attributes, e.g. the color remains as set originally.
To reproduce the problem use the code shown bellow, where two series are dynamically added, one with values in range (0,10) and the other with values in range (100, 1100). Two axes are defined with the corresponding ranges.
// code placeholder
import QtQuick 2.15
import QtQuick.Controls 2.15
import QtQuick.Window 2.15
import QtCharts 2.15Window {
    id: window
    visible: true
    width: 640
    height: 480
    title: qsTr("Charts")    ChartView {
        id: myChart
        title: "My chart"
        anchors.fill: parent
        antialiasing: true        ValueAxis {
            id: myAxisY
            min: 0
            max: 10
            gridVisible: true
            labelFormat: "%d"
            titleText: "Axis Y Left"
            tickCount: 5
            color: "red"
            onMinChanged: {console.log("Axis Y Left min changed: ", min)}
            onMaxChanged: {console.log("Axis Y Left max changed: ", max)}
        }        ValueAxis {
            id: myAxisYR
            min: 100
            max: 1100
            gridVisible: true
            labelFormat: "%d"
            titleText: "Axis Y Right"
            tickCount: 4
            color: "blue"
            onMinChanged: {console.log("Axis Y Right min changed: ", min)}
            onMaxChanged: {console.log("Axis Y Right max changed: ", max)}
        }        ValueAxis {
            id: myAxisX
            min: 0
            max: 20
            gridVisible: true
            labelFormat: "%d"
            titleText: "Axis X"
            tickCount: 3
        }        Component.onCompleted: {
            console.log("Number of Axis on initiation ", axes.length)            var seriesLeft = myChart.createSeries(ChartView.SeriesTypeLine, "left");
            seriesLeft.axisX = myAxisX;
            seriesLeft.axisY = myAxisY;
            seriesLeft.color = "red";            for(var j=0; j<10; j++)
            {
                var x = (Math.random() * 20);
                var y = (Math.random() * 10);
                seriesLeft.append(x, y);
            }            var seriesRight = myChart.createSeries(ChartView.SeriesTypeLine, "right");
            seriesRight.axisX = myAxisX;
            seriesRight.axisYRight = myAxisYR;
            seriesRight.color = "blue";            for(var i=0; i<10; i++)
            {
                x = (Math.random() * 20);
                y = (100 + Math.random() * 1000);
                seriesRight.append(x, y);
            }            console.log(axes.length ," Axes defined: ")
            for(var l=0; l<myChart.axes.length; l++)
            {
                console.log(axes[l], " titleText: ", axes[l].titleText)
            }
            console.log("======")
            console.log("series Left")
            console.log(axisX(seriesLeft), " axisX(seriesLeft).titleText: ", axisX(seriesLeft).titleText)
            console.log(axisY(seriesLeft), " axisY(seriesLeft).titleText: ", axisY(seriesLeft).titleText)
            console.log(seriesLeft.axisY, " seriesLeft.axisY.titleText: ", seriesLeft.axisY.titleText)
            console.log("======")            console.log("series Right")
            console.log(axisX(seriesRight), " axisX(seriesRight).titleText: ", axisX(seriesRight).titleText)
            console.log(axisY(seriesRight), " axisY(seriesRight).titleText: ", axisY(seriesRight).titleText)
            console.log(seriesRight.axisYRight, " seriesRight.axisYRight.titleText: ", seriesRight.axisYRight.titleText)
            console.log("======")            console.log("myChart")
            console.log(myChart.axisX(), " myChart.axisX().titleText: ", myChart.axisX().titleText)
            console.log(myChart.axisY(), " myChart.axisY().titleText: ", myChart.axisY().titleText)            // UNCOMMENT TO SEE HOW THE AXES VALUES CHANGE
//            console.log("Set myAxisYR.min = 100")
//            myAxisYR.min = 100
//            console.log("Set myAxisYR.max = 1100")
//            myAxisYR.max = 1100//            console.log("Set myAxisY.min = 0")
//            myAxisY.min = 0
//            console.log("Set myAxisY.max = 10")
//            myAxisY.max = 10
        }
    }
}
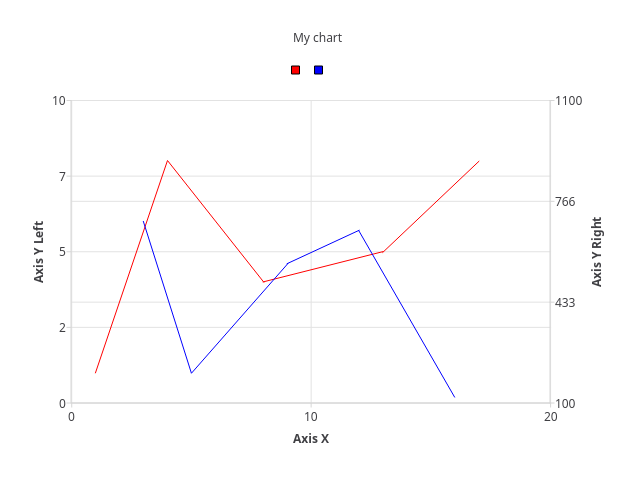
which should produce a chart like the one that follows. It is evident that both Y-Axes are in range (100, 1100), while the Left one should be (0,10).
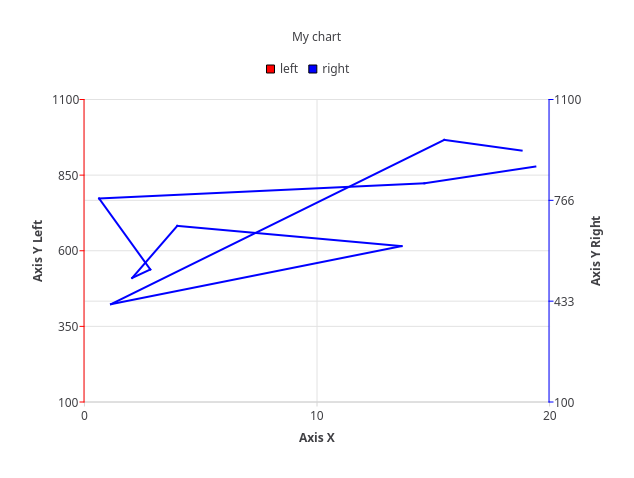
By un-commenting the last part in the code, the 'min' and 'max' values are manually set, and one can see that the Y-Axes now have both range (0, 10) since the Left Axis is set last (see picture bellow). By setting initial values of 'min' and 'max' for both Y-Axes to 0, makes more clear the assignment path which seems quite messed-up. For example, as shown in the log snippet bellow, by setting the min value of the Right Axis to 100 sets all the values of all verical Axes to 100. Not only the 'min's but also the 'max'es.
// code placeholder
qml: Set myAxisYR.min = 100
qml: Axis Y Right min changed:  100
qml: Axis Y Right max changed:  100
qml: Axis Y Left min changed:  100
qml: Axis Y Left max changed:  100
qml: Set myAxisYR.max = 1100
qml: Axis Y Right max changed:  1100
qml: Axis Y Left max changed:  1100
qml: Set myAxisY.min = 0
qml: Axis Y Left min changed:  0
qml: Axis Y Right min changed:  0
qml: Set myAxisY.max = 10
qml: Axis Y Left max changed:  10
qml: Axis Y Right max changed:  10
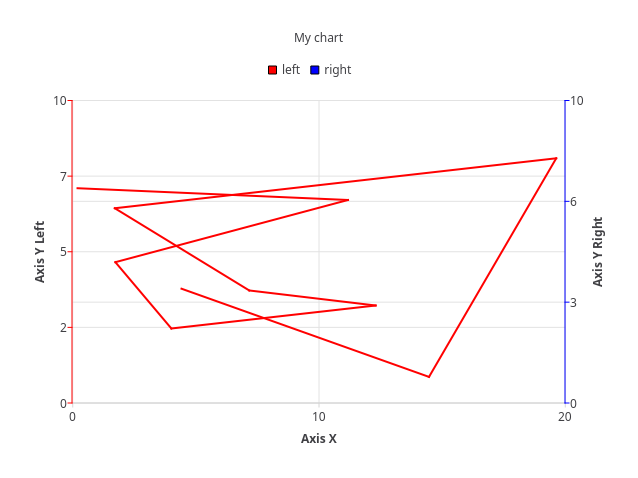
If the series are not created dynamically, the Y-Axes are as expected. Check the code bellow.
// code placeholder
import QtQuick 2.15
import QtQuick.Controls 2.15
import QtQuick.Window 2.15
import QtCharts 2.15Window {
    id: window
    visible: true
    width: 640
    height: 480
    title: qsTr("Charts")    ChartView {
        id: myChart
        title: "My chart"
        anchors.fill: parent
        antialiasing: true        ValueAxis {
            id: myAxisY
            min: 0
            max: 0
            gridVisible: true
            labelFormat: "%d"
            color: "red"
            titleText: "Axis Y Left"
            tickCount: 5            onMinChanged: {console.log("Axis Y Left min changed: ", min)}
            onMaxChanged: {console.log("Axis Y Left max changed: ", max)}
        }        ValueAxis {
            id: myAxisYR
            min: 0
            max: 0
            gridVisible: true
            labelFormat: "%d"
            titleText: "Axis Y Right"
            color: "blue"
            tickCount: 4            onMinChanged: {console.log("Axis Y Right min changed: ", min)}
            onMaxChanged: {console.log("Axis Y Right max changed: ", max)}
        }        ValueAxis {
            id: myAxisX
            min: 0
            max: 20
            gridVisible: true
            labelFormat: "%d"
            titleText: "Axis X"
            tickCount: 3
        }        LineSeries {
            id: leftSeries            color: "red"
            axisX: myAxisX
            axisY: myAxisY
            XYPoint {x: 1; y:1}
            XYPoint {x: 4; y:8}
            XYPoint {x: 8; y:4}
        }        LineSeries {
            id: rightSeries            color: "blue"
            axisX: myAxisX
            axisYRight: myAxisYR
            XYPoint {x: 3; y:700}
            XYPoint {x: 5; y:200}
            XYPoint {x: 9; y:560}
        }        Component.onCompleted: {
            console.log("Number of Axis on initiation ", axes.length)            leftSeries.append(13, 5)
            leftSeries.append(17, 8)            rightSeries.append(12, 670)
            rightSeries.append(16, 120)            console.log(axes.length ," Axes defined: ")
            for(var l=0; l<myChart.axes.length; l++)
            {
                console.log(axes[l], " titleText: ", axes[l].titleText)
            }            console.log("======")
            console.log("series Left")
            console.log(axisX(leftSeries), " axisX(leftSeries).titleText: ", axisX(leftSeries).titleText)
            console.log(axisY(leftSeries), " axisY(leftSeries).titleText: ", axisY(leftSeries).titleText)
            console.log(leftSeries.axisY, " leftSeries.axisY.titleText; ", leftSeries.axisY.titleText)            console.log("======")
            console.log("series Right")
            console.log(axisX(rightSeries), " axisX(rightSeries).titleText: ", axisX(rightSeries).titleText)
            console.log(axisY(rightSeries), " axisY(rightSeries).titleText: ", axisY(rightSeries).titleText)
            console.log(rightSeries.axisYRight, " rightSeries.axisYRight.titleText: ", rightSeries.axisYRight.titleText)            console.log("======")
            console.log("myChart")
            console.log(myChart.axisX(), " myChart.axisX(.titleText): ", myChart.axisX().titleText)
            console.log(myChart.axisY(), " myChart.axisY().titleText: ", myChart.axisY().titleText)            // UNCOMMENT TO SEE HOW THE AXES VALUES CHANGE
            console.log("Set myAxisYR.min = 100")
            myAxisYR.min = 100
            console.log("Set myAxisYR.max = 1100")
            myAxisYR.max = 1100            console.log("Set myAxisY.min = 0")
            myAxisY.min = 0
            console.log("Set myAxisY.max = 10")
            myAxisY.max = 10
        }
    }
}