-
Bug
-
Resolution: Cannot Reproduce
-
 P2: Important
-
None
-
Qt Creator 3.5.1
-
None
-
GNU/Linux, Debian/testing.
I'm doing package testing with what's about to be released as 5.5.1, using a freshly-minted license with "all the things" enabled.
I'm a new developer, so deliberately testing for things that a new user wouldn't know, that the system fails to help me learn.
The installer ended by offering to start QtCreator, which I duly let it do.
I created a trivial new QML application project; it set me up with a simple main.qml that displays a hello-world text in a rectangle and exits on click. (I amended the message wording; no other edits.) I ran clang static analysis and it was happy. Yay ! I ran it. It works. Yay ! So, time to see if it leaks memory.
Analyze -> Valgrind Memory Analyzer
ran my simple application, very slowly, and exited once I'd clicked on it, as expected.
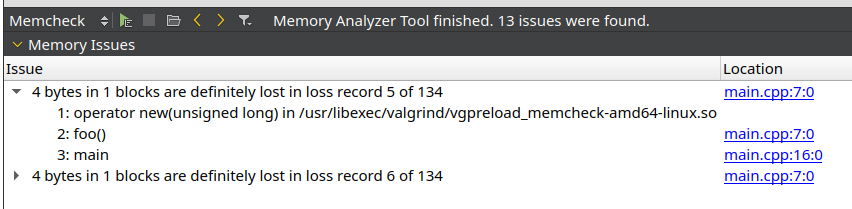
The Valgrind Memory Analyzer panel at the bottom of my source code display area reports, in its title bar, "Memory Analyzer Tool finished, 25 issues were found." It has handy little orange arrows to navigate to next and previous leaks. However, it displays nothing in its text area.
The Application Output panel below shows me output from my toy and (in a separate tab) from my clang analysis run, but no sign of any valgrind output. None of the other panels below shows anything I can interpret as valgrind errors.
I visit the Help system and find "Detecting Memory Leaks", which tells me to do the very steps that the UI helpfully and naturally lead me through, up to the help's step 5, where it shows me a roundish red icon that I can't find in the Analyze UI to click on. Apparently that red icon would show me my results. The QML/JS panel has the closest thing I can find to it, but it's clearly a red circle with a white ! in the middle of it; and not a plausible place to find Valgrind errors anyway.
I try locating the main.cpp and displaying its C++ code rather than the main.qml that's all I'd looked at previously; it made no difference.
I am unable to find anything that displays the errors valgrind allegedly detected.
Maybe the fact that I'm running a release build is implicated. If that's why there's no useful data to display, the system should say this out loud, in one of the places I could reasonably expect to find valgrind's errors reported. "Try again with a debug build and I might have something useful to show you."
Bug: when we have valgrind errors and a UI with which to navigate among them, we should actually show them; and the user should not need to know something arcane in order to get to see them.
Enhancement: where the help system shows an icon, that the user needs to use in the UI, it would be a little bonus help if it made its display of the icon match the UI's tooltip with a title text (displayed onhover) in the HTML. Then the user could be a bit more confident about having found the right icon (its tooltip is as expected), or about ignoring an icon that looks similar but is not convincingly the same (it has a different tooltip).