-
Task
-
Resolution: Done
-
P2: Important
-
Qt Creator 4.2.1
-
None
-
548a86f57722fb9513baa87a3562d4138d93970f
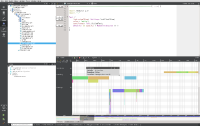
The valgrind profiler annotates the source files in the editor with text marks that show the relative cost each function had in the last profiling run. This is very handy. It would be nice to show the same for the QML profiler. By clicking on the text mark you would cause the QML Profiler view to show you more details on the function.
The attached screenshot shows how it should look like.
| For Gerrit Dashboard: QTCREATORBUG-17757 | ||||||
|---|---|---|---|---|---|---|
| # | Subject | Branch | Project | Status | CR | V |
| 170681,11 | QmlProfiler: Add text marks for QML/JS types into documents | master | qt-creator/qt-creator | Status: MERGED | -2 | 0 |
