-
Bug
-
Resolution: Done
-
P2: Important
-
Qt Creator 4.2.2, Qt Creator 4.3.0-beta1
-
Windows 10 64 bit
-
2080096ec3d9edbd03711b4da53d19d2afa3f940
- Open the QML Profiler.
- Load the attached trace
 .
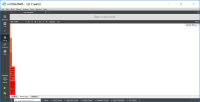
. - Show the Flame Graph for Memory.
It uses just a small part of the view's width:

The Flame Graph should either use the whole width or show a representation for the memory consumption which is not shown now but causes this scaling.