-
 User Story
-
Resolution: Out of scope
-
 P3: Somewhat important
-
None
-
None
-
None
R&D effort: 1,5 man-months
Business rationale behind this user story:
What is missing in Qt's offering
Aspects like FPS of a running user interface are an important factor. Many developers of an embedded QML UI will at some point want to tweak their software while keeping an eye on FPS or other performance factors.
While the QML profiler in Qt Creator offers the possibility to closely analyze all kinds of interesting data, users still seem to like to have very a simplified, live view on single performance aspects (such as an FPS counter).
That is the reason why there are many implementations of Qt Quick FPS counters out there, some of them in demos by TQtC. Most of them are blended on the QML scene, and therefore, influence the application performance. There is no reusable FPS display component in Qt.
Technical approach:
Possible addition to the QML tooling
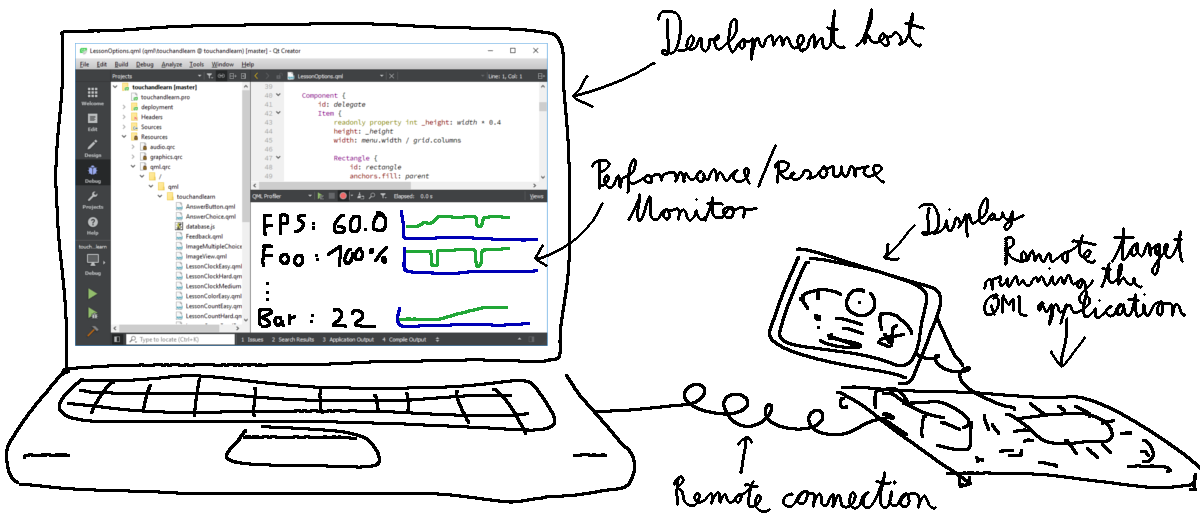
Qt Creator could offer a feature that allows for live monitoring of Performance/Resource data of running QML applications (also on remote devices). It would be a complementary feature to the QML profiling feature. While QML profiler allows for very precise and thorough post-analysis of the runtime behavior of an application, this Live Monitor could be very light, easy to use and glanceable.

The feature could be implemented as an additional QML debug service in Qt. That service would be a "light" one which could be run in parallel with other debug services (profiler, livepreview, etc.) on the remote side. The client side (Qt Creator) could receive a couple of data streams for performance aspects and display them as live value with a simple trend chart.
Performance aspects to monitor
FPS is certainlly the most obvious piece of data. Also other, easy to obdain data, which don't slow down the application should be tracked. Perhaps some things which the QML profiler also tracks, such as JavaScript memory consumption, Pixmapcache size, etc..
Perhaps also some system specific items such as current CPU and GPU consumption could be possible.