-
Bug
-
Resolution: Unresolved
-
P3: Somewhat important
-
None
-
Qt Creator 5.0.1
-
Arch Linux x64
lldb version 12.0.1
GNU gdb (GDB) 10.2
valgrind-3.17.0
When I'm using a kit with the debugger set to LLDB rather than GDB, and I click menu Analyze -> Valgrind Memory Analyzer with GDB, then Valgrind errors don't trigger the Qt Creator debugger breakpoint at the location of the error.
When the application exits, Qt Creator says "Debugging of ... has finished." and the "Debugger" pane acts like debugging is finished (says "Start debugging of startup project"), but the "Application Output" pane still acts like the app is running (shows a red stop square), and the menu items "Analyze -> Valgrind Memory Analyzer [with GDB]" are still grayed out.

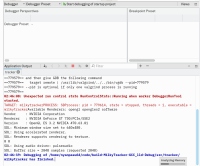
When I press the red stop square, I get the following messages:
02:39:39: The program has unexpectedly finished.
02:39:39: Process terminated.
02:39:39: Analyzing finished.
I do not get these problems using GDB as a debugger backend. Breaking on error works. Exiting the application exits the "Application Output" and "Debugger" panes, and re-enables the "Analyze -> Valgrind Memory Analyzer [with GDB]" menu items.
However, with both GDB and LLDB, I get an error "Unexpected run control state RunControlState::Running when worker DebuggerRunTool started." when starting debugging.
