-
Bug
-
Resolution: Fixed
-
 Not Evaluated
-
Qt Creator 6.0.1
-
None
-
Windows 10, see body for hardware specs
-
Windows
tl:dr;
In src/libs/cplusplus/pp-engine.cpp, Preprocessor::handleFunctionLikeMacro creates a QVector<PPToken> and then calls QVector::reserve(MAX_TOKEN_EXPANSION_COUNT). MAX_TOKEN_EXPANSION_COUNT=5000, so this forces the allocation of a substantial amount of memory. Since preprocessing happens from multiple threads concurrently, and since (AFAIK) there is no attempt to use separate heaps for each thread, this allocation (and deallocation) requires a lock (at the OS level). This lock contention makes the preprocessor quite slow on systems with a substantial number of cores.
I am using QtC 6.0.1 on Windows 10. Creator often is very sluggish when opening, closing, and editing files. My machine has a 16 physical core/32 virtual core CPU, 32 GB memory, and all storage is on NVMe SSD drives, so I think it is fair to expect good performance based on my hardware.
The project I am using is very large (>5 million loc) and poorly organized. It uses PCH. The PCH include file includes > 100 other files, many of which include additional files. I realize this isn't ideal and I am working on improving this, but it's the situation I am faced with. The project won't compile with PCH disabled so I don't know whether PCH has anything to do with the problem I describe below.
The clang code model is enabled. In the C++ settings/Code Model tab of preferences, I have only "Do not index files greater than 5 MB" checked. clangd is disabled.
I recently noticed in Task Manager that QtC was using ~4% CPU (equivalent to a bit over 1 core) when it had only 2 documents open and Creator had been unused (after performing a compile) for several minutes. I wouldn't expect Creator to be using CPU at all under these circumstances, so I investigated by collecting ETW traces.
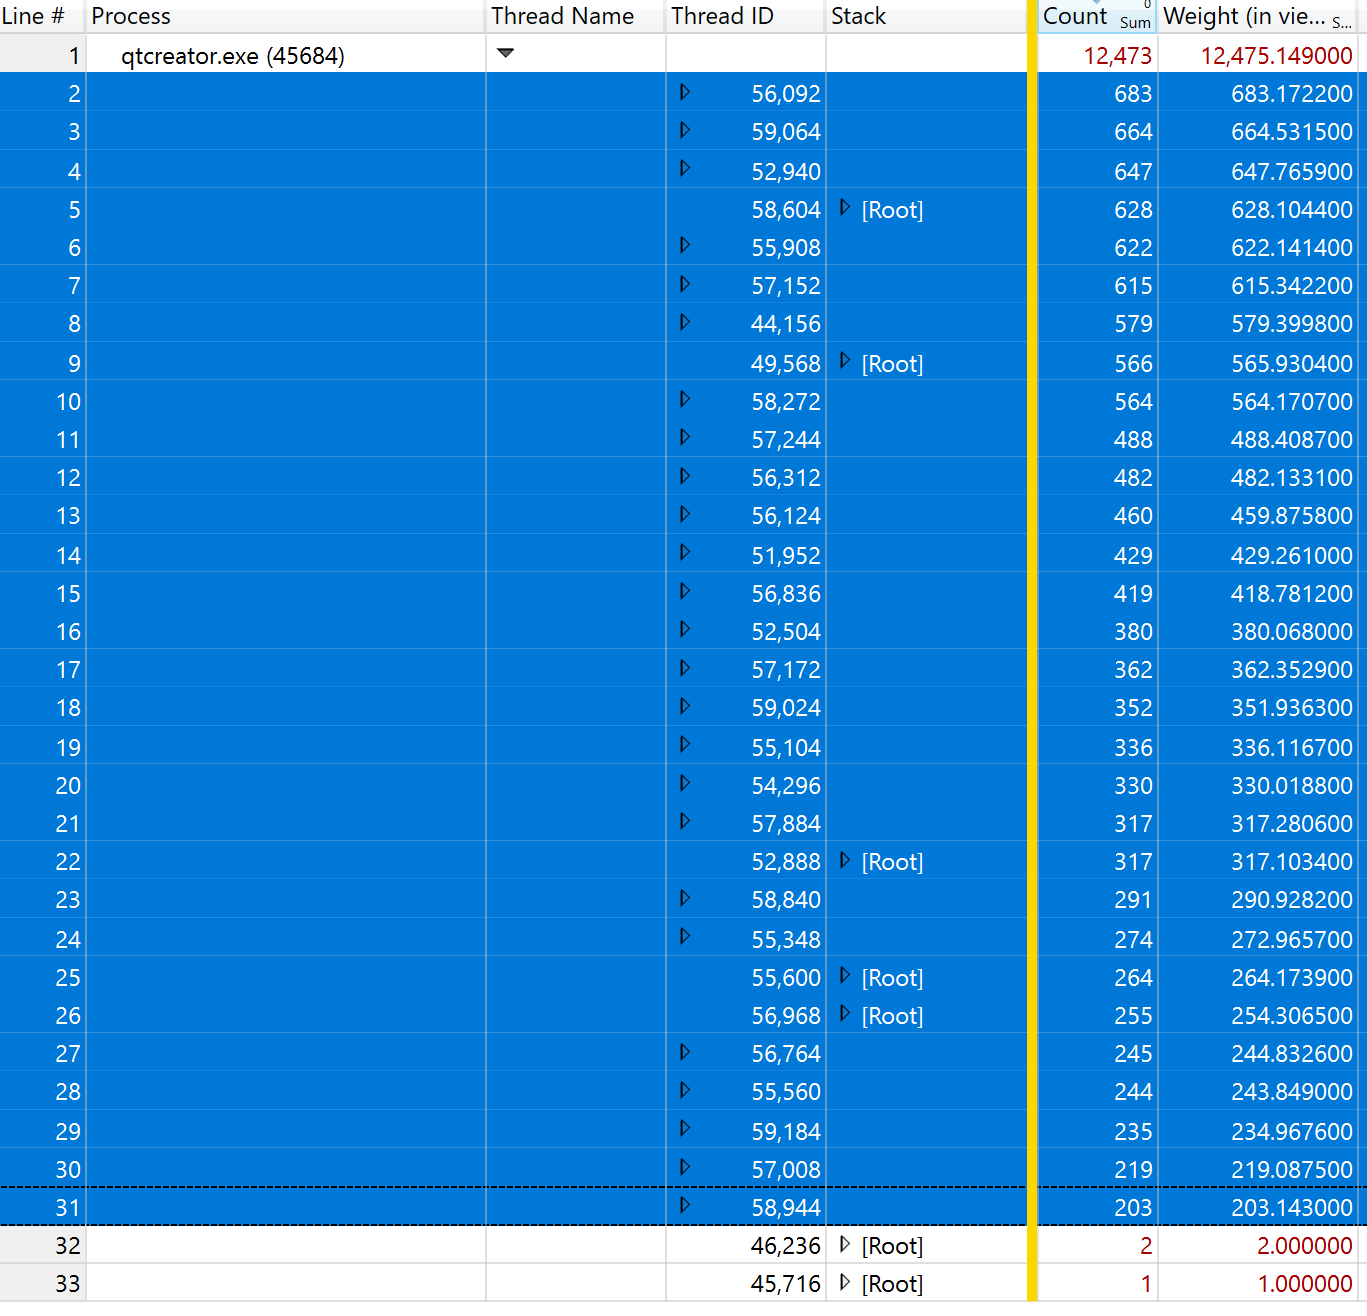
The traces I collected were about 11 seconds long. During that time, QtC used ~12.5 s of CPU time. It did this across 32 threads. 30 of the 32 threads (selected in the image below) have essentially the same stack traces and the remaining analysis applies in principle to all 30 of these threads, though obviously the timing values would be different.

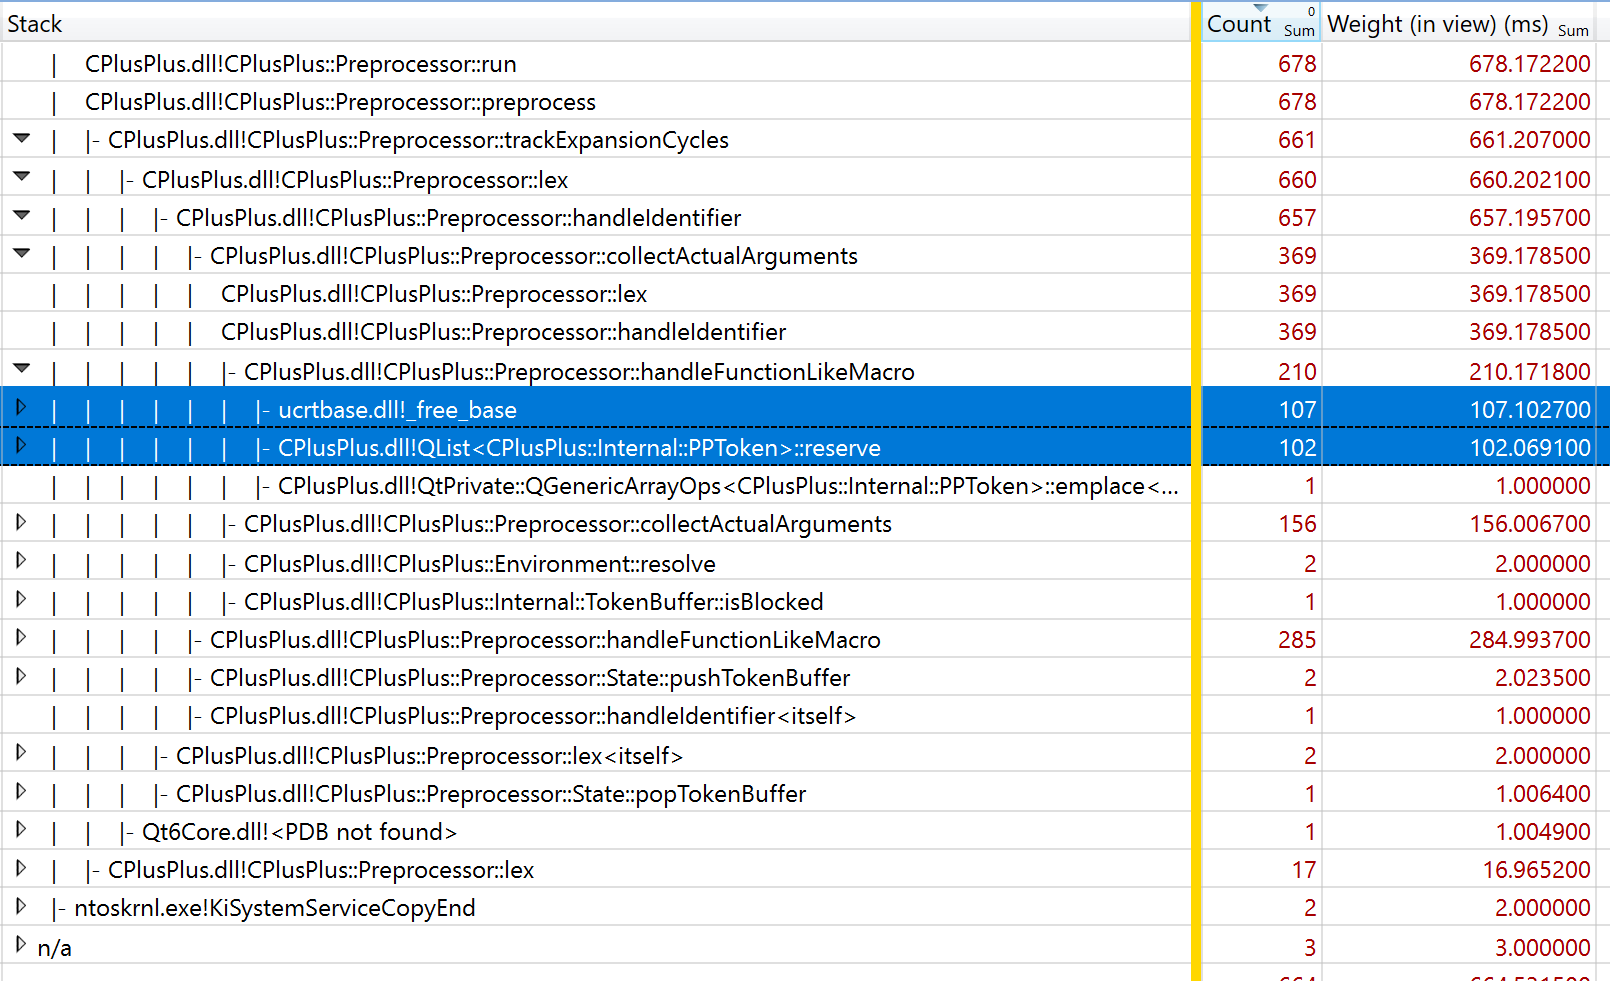
When I expand the stack of thread 56,092, the most expensive tree of the stack shows that handleFunctionLikeMacro is responsible for 210 ms of a total of ~680 ms. Within handleFunctionLikeMacro, essentially all of the time is spent in QList::reserve and free (these two lines are selected below):
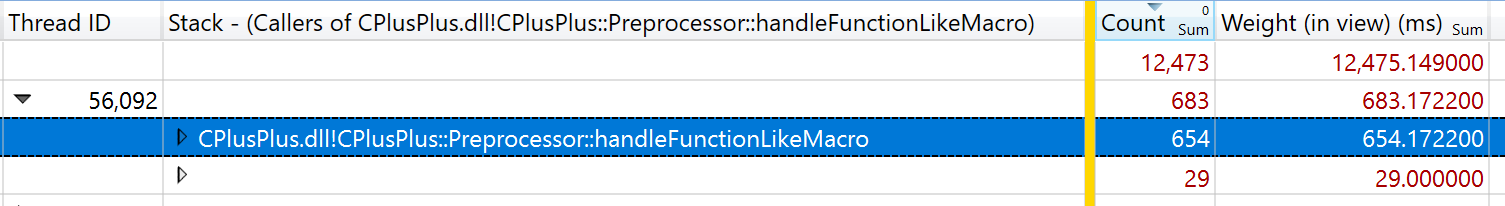
If I look at all of the data from that same thread (not just the most expensive branch of the tree), it is clear that handleFunctionLikeMacro is responsible for almost all of the cost (654 of 683 ms total):
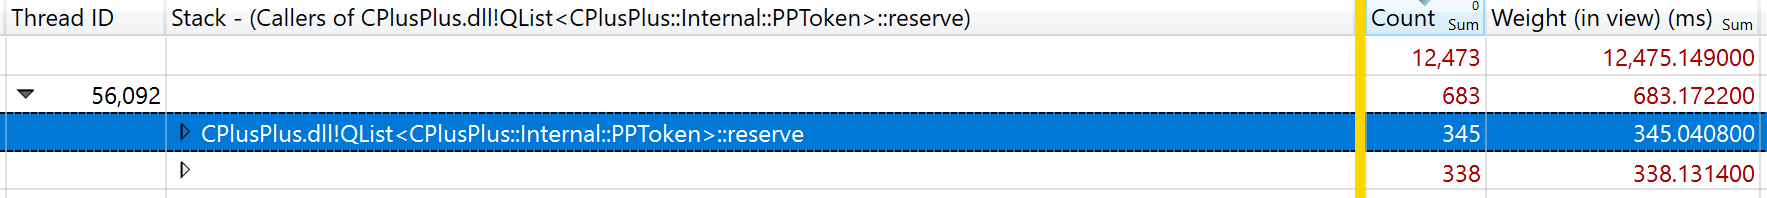
I can dive a bit further and find the total cost of QList::reserve (345/683 ms):
and free (306 of 683 ms):
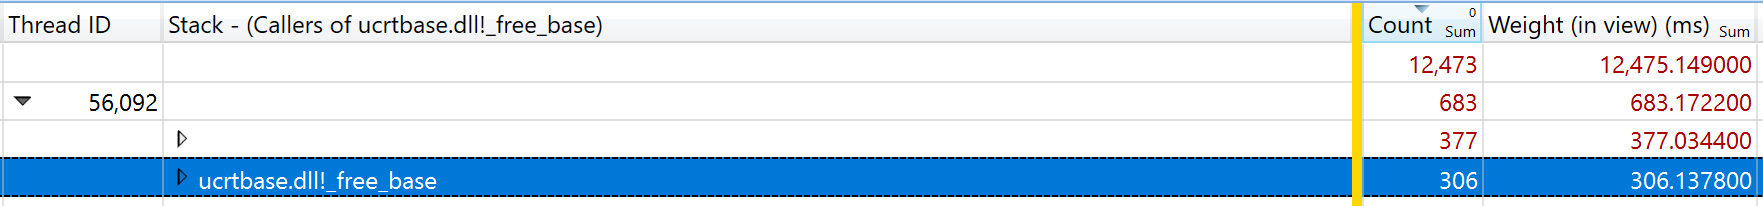
Note that the two images above show ALL calls to QList::reserve and free (not just calls made from handleFunctionLikeMacro. But clearly it is the calls from within handleFunctionLikeMacro that are the problem.
It does not appear to me that the thread pool used by the cpptools plugin is making any attempt to use separate heaps for each of the threads it creates. Therefore it is not surprising that frequently allocating and deallocating a large chunk of memory from different threads will result in a large amount of contention.
Since handleFunctionLikeMacro isn't called recursively, I think this problem could be solved by adding a QVector<PPToken> member (or a pointer to a QVector) to the Preprocessor class. That would avoid the need to (possibly) allocate and deallocate this large amount of memory for each token that is processed by lex.
My colleagues with 8 core/16 thread CPUs (and otherwise similar hardware) have not reported the same sluggishness of QtC that I observe. That's not surprising if I'm right in my analysis of the problem. Since 16 core machines are pretty rare, I have not attempted to reproduce the problem using a project that is publicly available. But I can reproduce what I described above on my own machine and I have collected other traces that show similar results.


| For Gerrit Dashboard: QTCREATORBUG-26841 | ||||||
|---|---|---|---|---|---|---|
| # | Subject | Branch | Project | Status | CR | V |
| 389617,2 | CPlusPlus: Do not needlessly allocate space for a vector | master | qt-creator/qt-creator | Status: MERGED | +2 | 0 |
| 390061,1 | CPlusPlus: Do not needlessly allocate space for a vector | 6.0 | qt-creator/qt-creator | Status: ABANDONED | -1 | 0 |