-
Task
-
Resolution: Fixed
-
 P2: Important
-
None
-
None
-
None
-
c7c0c43d7644740cfd341c57d70c1e64e3e64d7f
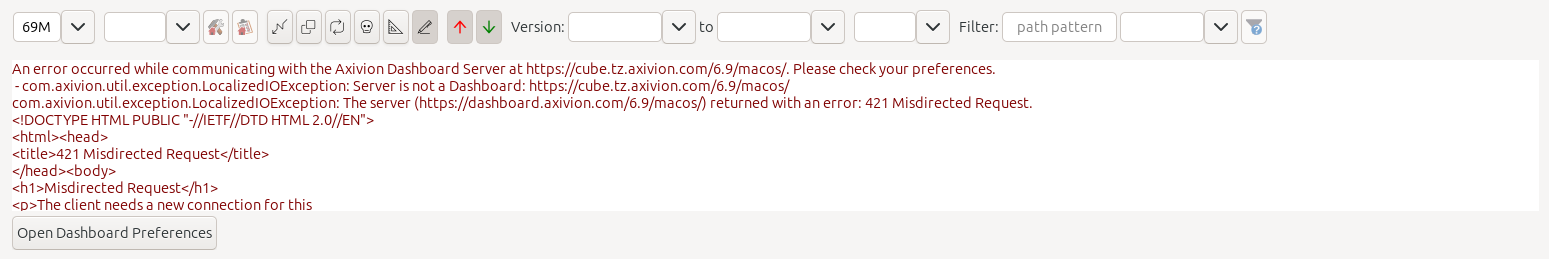
This would really enhance the first-use experience as the Analyse -> Axivion view in its pristine state really leaves the user without a clue what to do.
In the below screenshot, you can see, that the eclipse plugin in many error states does as can be seen in the screenshot below. So basically the error is shown in the issue-table area, and a button (that in normal operation is not visible) gives quick access to the settings. The erro message in the initial state could read something along the lines of "No dashboard connections configured". If displaying such a button is unfeasible, extending the message with "Go to Edit -> Preferences -> Axivion to add one" would be a suitable alternative.