-
Bug
-
Resolution: Done
-
 Not Evaluated
-
None
-
Qt Creator 16.0.2
-
None
-
Qt 5.15.0 project (GDB 11.2.0 + MinGW 8.1.0)
Qt 6.9.1 project (GDB 13.1.0 + MinGW 13.1.0)
Hi , everyone~
In Qt Creator 16.0.2, any breakpoint you set before starting the debugger is hit as expected. However, if you try to add a new breakpoint after the application is already running the IDE marks it but it never becomes "active" and won't be hit (and can even cause the debugger to hang when setting it).
What I've Tried
Start debugging with a breakpoint on MainWindow::~MainWindow() → hit OK.
Once running, click in the margin at QApplication a(argc, argv); to add a new breakpoint → turns red/grey but never activates.
Stop & restart with that breakpoint set before launching → it works perfectly.
This happens identically in:
Qt 5.15.0 project (GDB 11.2.0 + MinGW 8.1.0)
Qt 6.9.1 project (GDB 13.1.0 + MinGW 13.1.0)
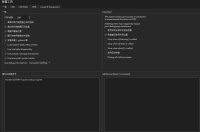
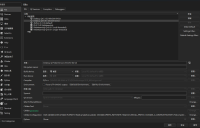
Image 1: Breakpoint on MainWindow::~MainWindow() (set before run) is recognized and hit.

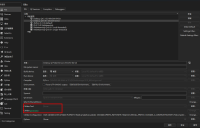
Image 2: Breakpoint on QApplication a(argc, argv); (added after run) turns grey and never hits.

Debugger Log:
d[GDB] TAKING OWNERSHIP OF BREAKPOINT 37
d[GDB] RUNNING NEEDS-STOP COMMAND -break-insert -f ""D:/Project/QT_Project/untitled/mainwindow.cpp":8"
<559-break-insert -f ""D:/Project/QT_Project/untitled/mainwindow.cpp":8"
d[GDB] 559: -break-insert -f ""D:/Project/QT_Project/untitled/mainwindow.cpp":8"
d[GDB] 560: -break-insert -f ""D:/Project/QT_Project/untitled/mainwindow.cpp":13"
d[GDB] TIMED OUT WAITING FOR GDB REPLY. COMMANDS STILL IN PROGRESS: "-break-insert -f ""D:/Project/QT_Project/untitled/mainwindow.cpp":8"", "-break-insert -f ""D:/Project/QT_Project/untitled/mainwindow.cpp":13""
I have recorded a video, which you can view at the following URL: https://youtu.be/acRtNZ6PJOs
.


