-
Bug
-
Resolution: Done
-
 P2: Important
-
Qt Creator 2.4.0
-
None
-
Windows 7 64bit SP1
MSVS 2010 Express, Debugging Tools for Windows (x64)
used Qt version: Qt 4.7.4 for Symbian Belle (from QtSDK)
Toolchain: GCCE with PythonGDB from QtSDK
When debugging a QML application using mixed debugging C++/QML does not work as expected.
Breakpoints
- Starting the debug process with breakpoints inside the C++ file (with/without breakpoints inside QML file(s)):
breakpoints inside C++ get hit, but I'm getting error messages from the QDeclarativeDebugServer of "Could not connect to the in-process QML debugger." If I'm pressing the Retry button I can see inside the debugger log that the QML Debugger gets reconnected, but after a few seconds it gets disconnected again and the MessageDialog appears again. (see attached DebuggerLog.txt)
- Starting the debug process with breakpoints inside the QML file(s) only:
breakpoints get hit, no error messages from the QDeclarativeDebugServer
Step Into
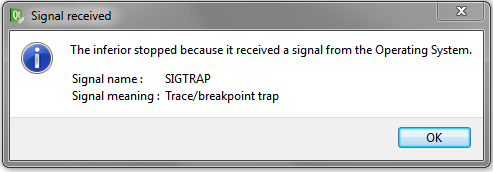
- When using the "Step into" (after hitting a breakpoint inside a QML file) that leads into a JS file I'm getting a SIGTRAP error MessageDialog (see attached SIGTRAP.png). The debugger goes right into the correct JS function but fails to work on after the MessageDialog appeared. (see attached DebuggerLog2.txt)