Uploaded image for project: 'Qt Creator'
  1. Qt Creator
  2. QTCREATORBUG-8996

QML Profiler displays inconsistent shortest time

XMLWordPrintable

    • I66a236a024d76e7bef6edfb91ae30b5dd098b76b

      1. Create a Qt Quick 1 Application and configure it with Qt 4.
      2. Add some JavaScript to main.qml.
        I used:
        import QtQuick 1.1
        
        Rectangle {
            width: 360
            height: 360
            Text {
                text: qsTr("Hello World")
                anchors.centerIn: parent
            }
            Timer {
                interval: 2000
                repeat: true
                running: true
                onTriggered: {
                    var i;
                    for (i = 1; i < 2500; ++i) {
                        var j;
                        j = i * i;
                        console.log(j);
        
                    }
                }
            }
        
            MouseArea {
                anchors.fill: parent
                onClicked: {
                    Qt.quit();
                }
            }
        }
        
      3. Build this and run it in QML Profiler.
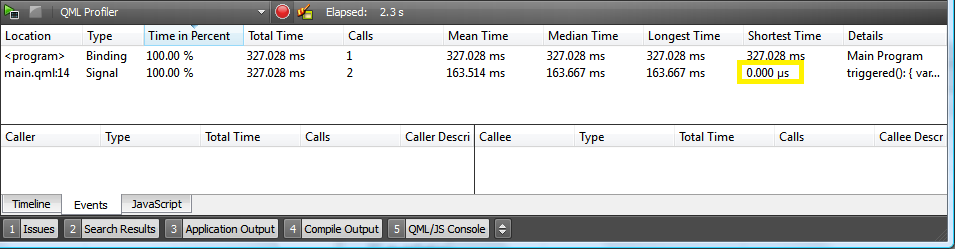
      4. On the Events tab, right click and select "Extended Event Statistics".
        The QML Profiler will in some lines display "Shortest Time" of 0.000 μ. This is inconsistent with the other data:

      Found by Squish test tst_simple_analyze.

        1. events.png
          32 kB
          Robert Löhning
        No reviews matched the request. Check your Options in the drop-down menu of this sections header.

            cjanssen Christiaan Janssen (Inactive)
            rlohning Robert Löhning
            Votes:
            0 Vote for this issue
            Watchers:
            2 Start watching this issue

              Created:
              Updated:
              Resolved:

                There are no open Gerrit changes