-
Suggestion
-
Resolution: Unresolved
-
 Not Evaluated
-
None
-
None
-
None
The old page to check blacklist overview is being deprecated:
https://testresults.qt.io/grafana/d/3dhio4K7k/fastcheck-ci-test-info
We need a new page/section to check for blacklisted test history like in the old dashboard. There's a dashboard to look for blacklisted tests overview in nightlies:
https://testresults.qt.io/grafana/d/000000022/blacklisted-tests-overview
But it is not as quick/handy to look for a specific test(+function) and see its long history in all runs and which platforms are affected by the blacklist. I tried filtering test cases in the table but they were not found but exist in the deprecated dashboard.
Case example:
I am adding a new platform to Coin: Windows 11 24h2, it will eventually replace Windows 11 23H2.
24H2 got a full qt/qt5 Coin run. It has several modules with failing tests. First thing I do is go to Grafana to check for each test: is the failing test blacklisted on the previous platform 23h2.
In the old page (that is being deprecated), a nice context is seen in dev branch for a test:
http://testresults.qt.io/grafana/d/3dhio4K7k/fastcheck-ci-test-info?from=2024-09-21T11:33:34.863Z&to=2024-11-20T11:33:34.863Z&timezone=utc&var-testCase=tst_qwindowcapturebackend&var-testFunction=$__all&var-branch=dev
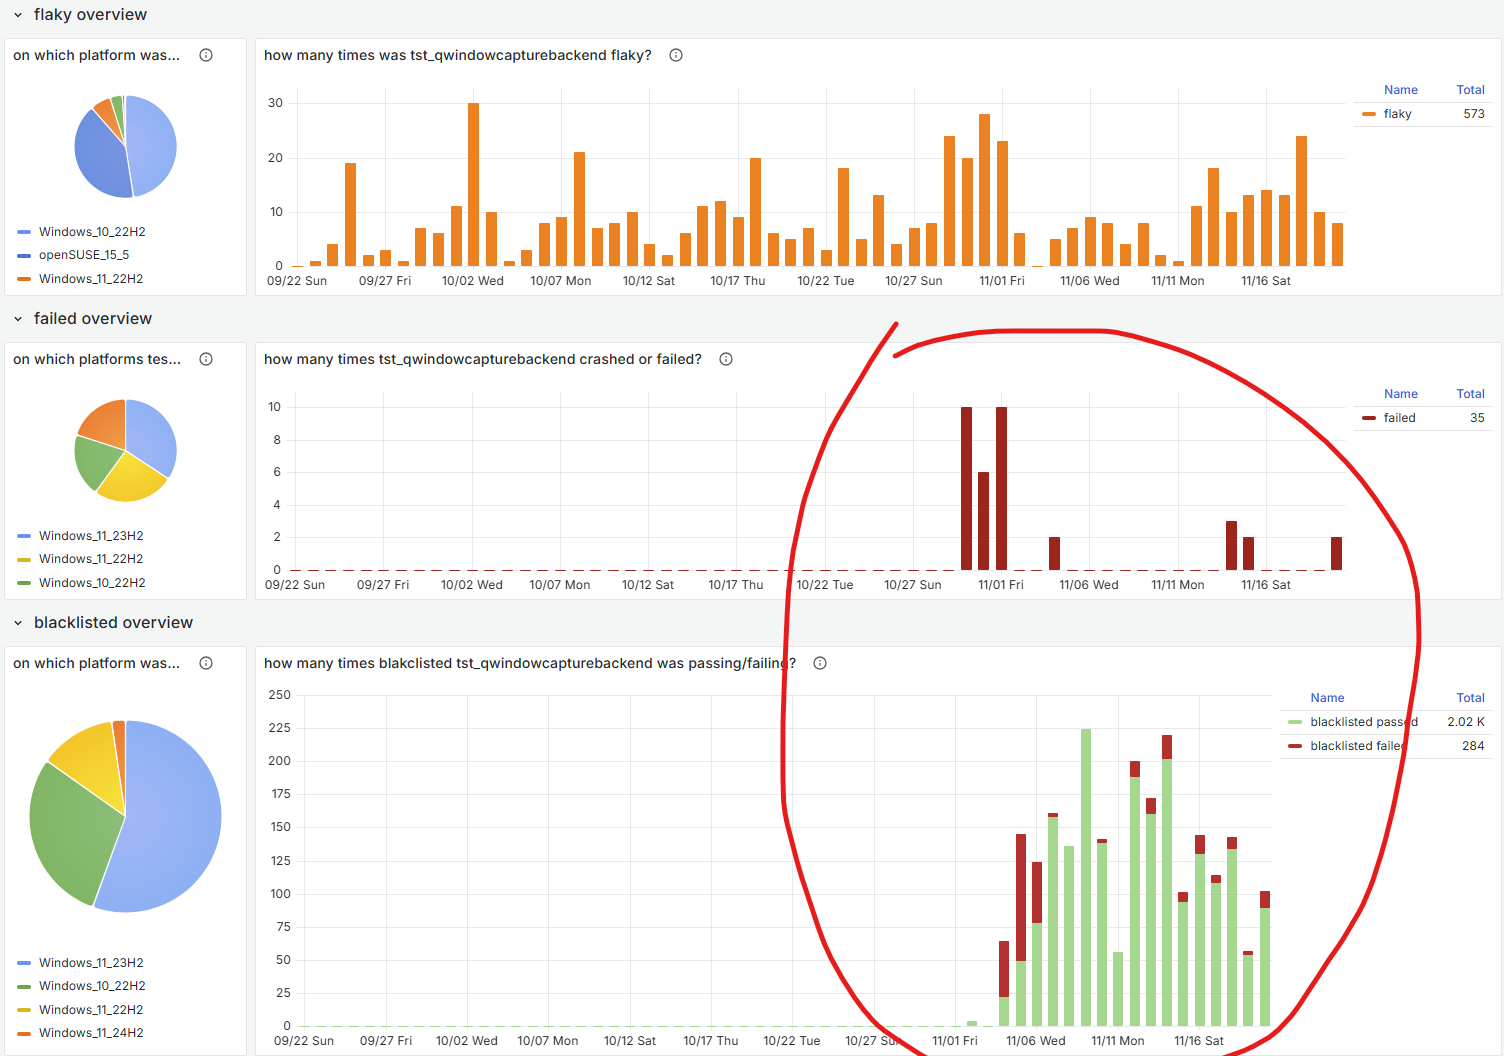
(in this case the specific function I'm looking for is not blacklisted and this graph shows all functions of a test, but the point still stands if this were a test+function)
I can see an important context: a test has been flaky and it got faily -> it has been blacklisted -> this is the cause of why the test no longer fails in 23h2 but does in 24h2. I can also see how often this particular test passes/fails when blacklisted (is the event that caused the flaky test to fail temporary).
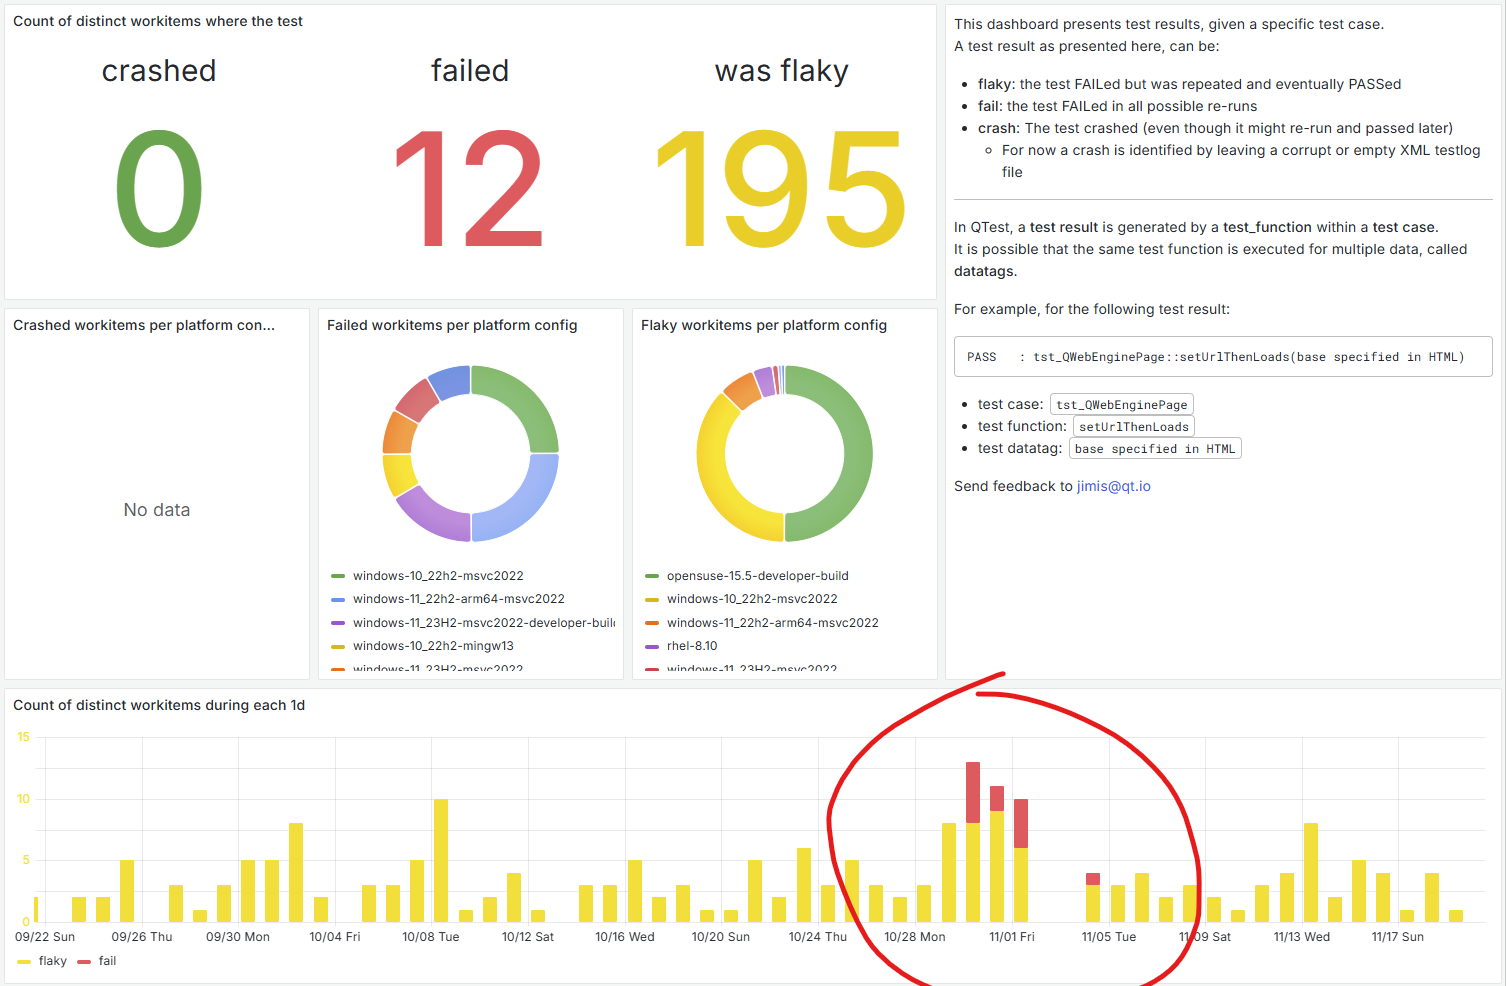
This context is missing in the new page, I cannot know from a glance why the test stopped failing:
http://testresults.qt.io/grafana/d/d8bebf9c-6e1c-4bff-a214-8d506943f23c/new-flaky-crashed-failed-tests?var-group_by_interval=1d&from=2024-09-21T11:07:16.624Z&to=2024-11-20T12:07:16.624Z&var-branch=1&var-test_case_n=1755&var-test_function_n=$__all

There are no (non-deprecated) pages that have this same view. The most critical priority for my use case is to get a page that can be used to quickly look if a test is blacklisted and in which platforms.
The lesser nice-to-have is to include the possible blacklist state of a test to the "Flaky/Crashed/Failed Tests"-page, it can be indicated the same way is in the old page ("blacklisted overview"-graph in parallel to other graphs) or some other way (blacklisted fail = different coloration in graph + blacklisted platforms pie chart). The main goal is to see why the blocking fails have stopped: were they something temporary, blacklisted or fixed (or skipped).