Context
Recently, in one of my projects, we were confronted to a design limitation of PythonQwt for plotting curves in a Python-Qt application. PythonQwt is quite good at plotting huge amount of data (e.g. 20,000x20,000 pixel images or +10Mpt curves, and so on) and manipulate it without any visual lag, especially with PySide2 since PYSIDE-1366 bug fix (thanks again). In that use case, this is the fastest library I know about for Python-Qt based applications. However, when embedding 10 plotting widgets or more, there are so much ticks and labels to draw when building plot scales that it becomes quite slow and there is a significant impact on main window's resize events for example.
So, I am currently thinking about how to improve (or replace) PythonQwt. For that purpose, I wrote a test script to study curve plotting performance with three major Python libraries using Qt (PyQt5 or Pyside2): Qt Charts, PythonQwt and Matplotlib.
Use case and test result
When trying Qt Charts, I noticed an unexpected performance issue when adding data to the QLineSeries - that is the object representing the curve to be added to the Qt Charts main widget (i.e. the QChart instance). Adding data to a QLineSeries object can be done using the "append" method (known to eventually be slow) or the "replace" method (which is the fastest way when passing data using a "QVector" object).
Furthermore, the PySide2 implementation is around 3 times worse than PyQt5.
Here are the results when comparing to PythonQwt for example:

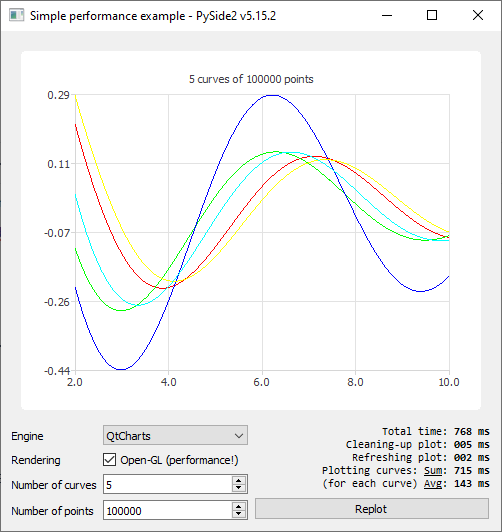
Plotting 5 curves of 100000 points with QtCharts (PySide2 v5.15.2):
Total time: 768 ms
Cleaning-up plot: 005 ms
Refreshing plot: 002 ms
Plotting curves: Sum: 715 ms
(for each curve) Avg: 143 ms (which is huge)
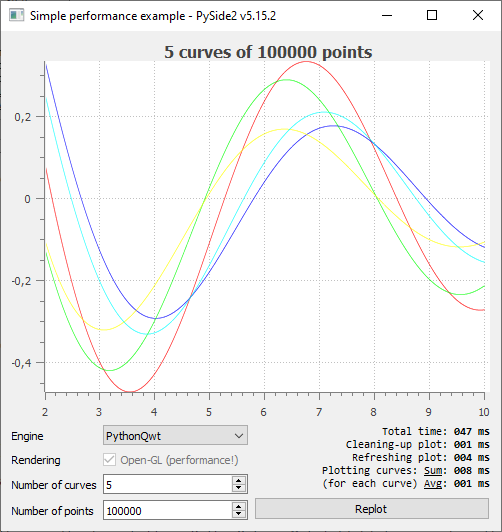
Plotting 5 curves of 100000 points with PythonQwt (PySide2 v5.15.2):
Total time: 047 ms
Cleaning-up plot: 001 ms
Refreshing plot: 004 ms
Plotting curves: Sum: 008 ms
(for each curve) Avg: 001 ms
Note that PythonQwt appears to be much faster than Qt Charts in that context, which is quite unexpected because PythonQwt is pure Python.
The attach script (qt_plot_test.py![]() ) may be executed (with or without installing PythonQwt or Matplotlib) to reproduce the results above.
) may be executed (with or without installing PythonQwt or Matplotlib) to reproduce the results above.
Origin
Anyway, the performance issue only comes from line 212, i.e. when adding points to the QLineSeries object using the "replace" method. I think that it's taking so much time because the QPolygonF object is converted to a list instead of taking advantage of its fast-indexing nature.
I'm sure that it's possible to reduce this time to almost nothing if the QPolygonF object is directly used to add data to the QLineSeries object.
What is really at stake ?
Well, apart from providing beautiful screenshots, I would like to insist on what's at stake here, to try and motivate you for fixing this issue ![]() . I think that "Qt Charts" is a promising plotting library. But, the fact that it's not able to plot smoothly 100k-point curves is a deal breaker for any serious scientific/technical data visualization project (for the record, 100k is really not that much: when visualizing scientific data, we often plot 1M points or more).
. I think that "Qt Charts" is a promising plotting library. But, the fact that it's not able to plot smoothly 100k-point curves is a deal breaker for any serious scientific/technical data visualization project (for the record, 100k is really not that much: when visualizing scientific data, we often plot 1M points or more).
If this issue is fixed, I am seriously considering to replace PythonQwt by Qt Charts: this would mean adding all the signal/image processing features of guiqwt to a new library which would be built on top of Qt Charts. And that would be great, wouldn't it?

- relates to
-
PYSIDE-1540 QPainter.drawPoints performance issue
-

- Closed
-
-
PYSIDE-1880 Conversion from numpy.ndarray to QSurfaceDataArray
-

- Closed
-