Uploaded image for project: 'Qt'
  1. Qt
  2. QTBUG-125232

QtCharts/QtGraphs: adding "break" to axis

XMLWordPrintable

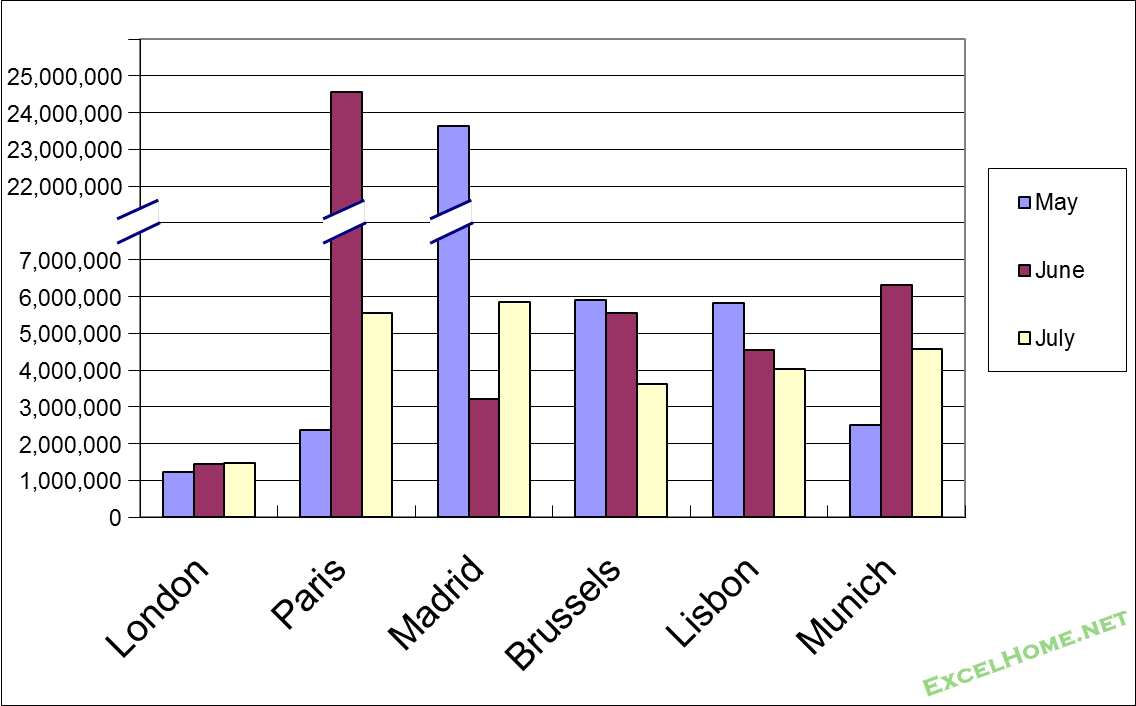
      By "break" I mean something like the attached graph. The y-axis has its "break" to compress the range. Also, the corresponding part of data of "Paris" and "Madrid" is also compressed so that it fits better with the rest.

      I'd say it is a common use case in statistics but there is yet no such API in charts/graphs module.

        No reviews matched the request. Check your Options in the drop-down menu of this sections header.

            kagro Kaj Grönholm
            luqiaochen Luqiao Chen
            Votes:
            0 Vote for this issue
            Watchers:
            3 Start watching this issue

              Created:
              Updated:
              Resolved:

                There are no open Gerrit changes