-
Bug
-
Resolution: Done
-
 P2: Important
-
5.10
-
None
-
f5abe488f1e7c9c31badd0622b7374648bea943a
As http://kgronholm.blogspot.no/2017/11/qt-510-qml-shape-testing.html points out, there can be some potential performance bottlenecks with Shapes in certain cases. Investigate this.
Some results
Played a bit with the comparison app on Linux (Intel graphics with Mesa - this needed a 3.3 QSurfaceFormat in main since defaulting to 3.0 will cause the version 150 (3.2) shaders not to compile).
First of all, only 3 tests use Shapes, the others are standard Qt Quick stuff (Rectangle, Text, etc.) so ideally main.qml should be modified to the following in order to avoid confusion:
property int enabledTests: 2+4+32
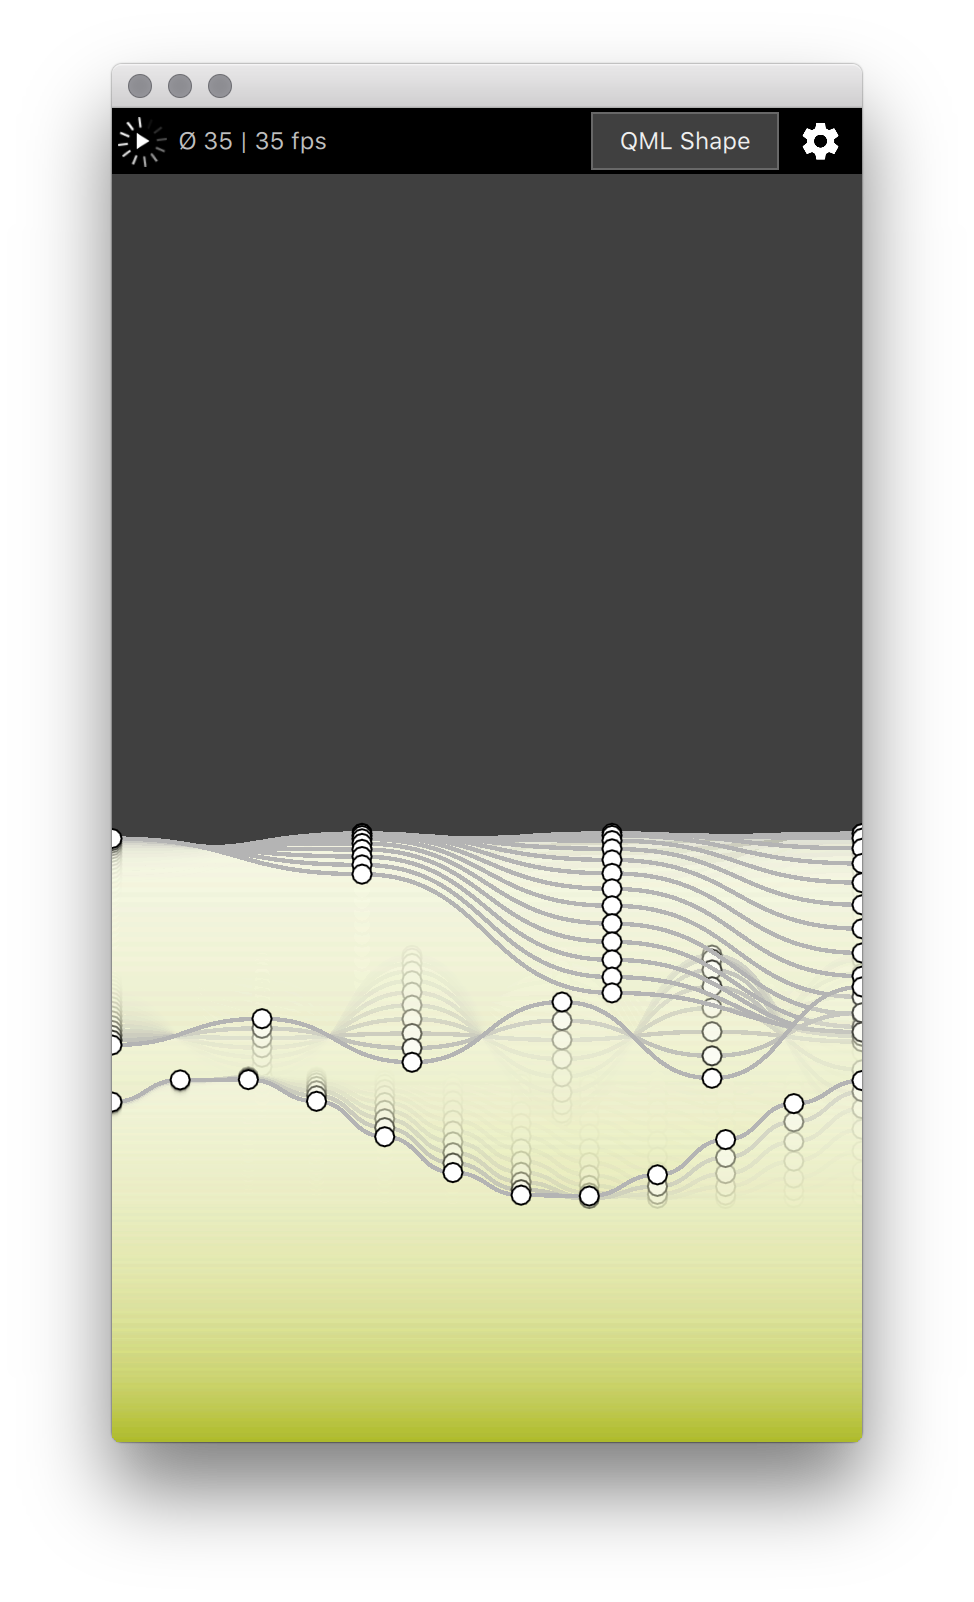
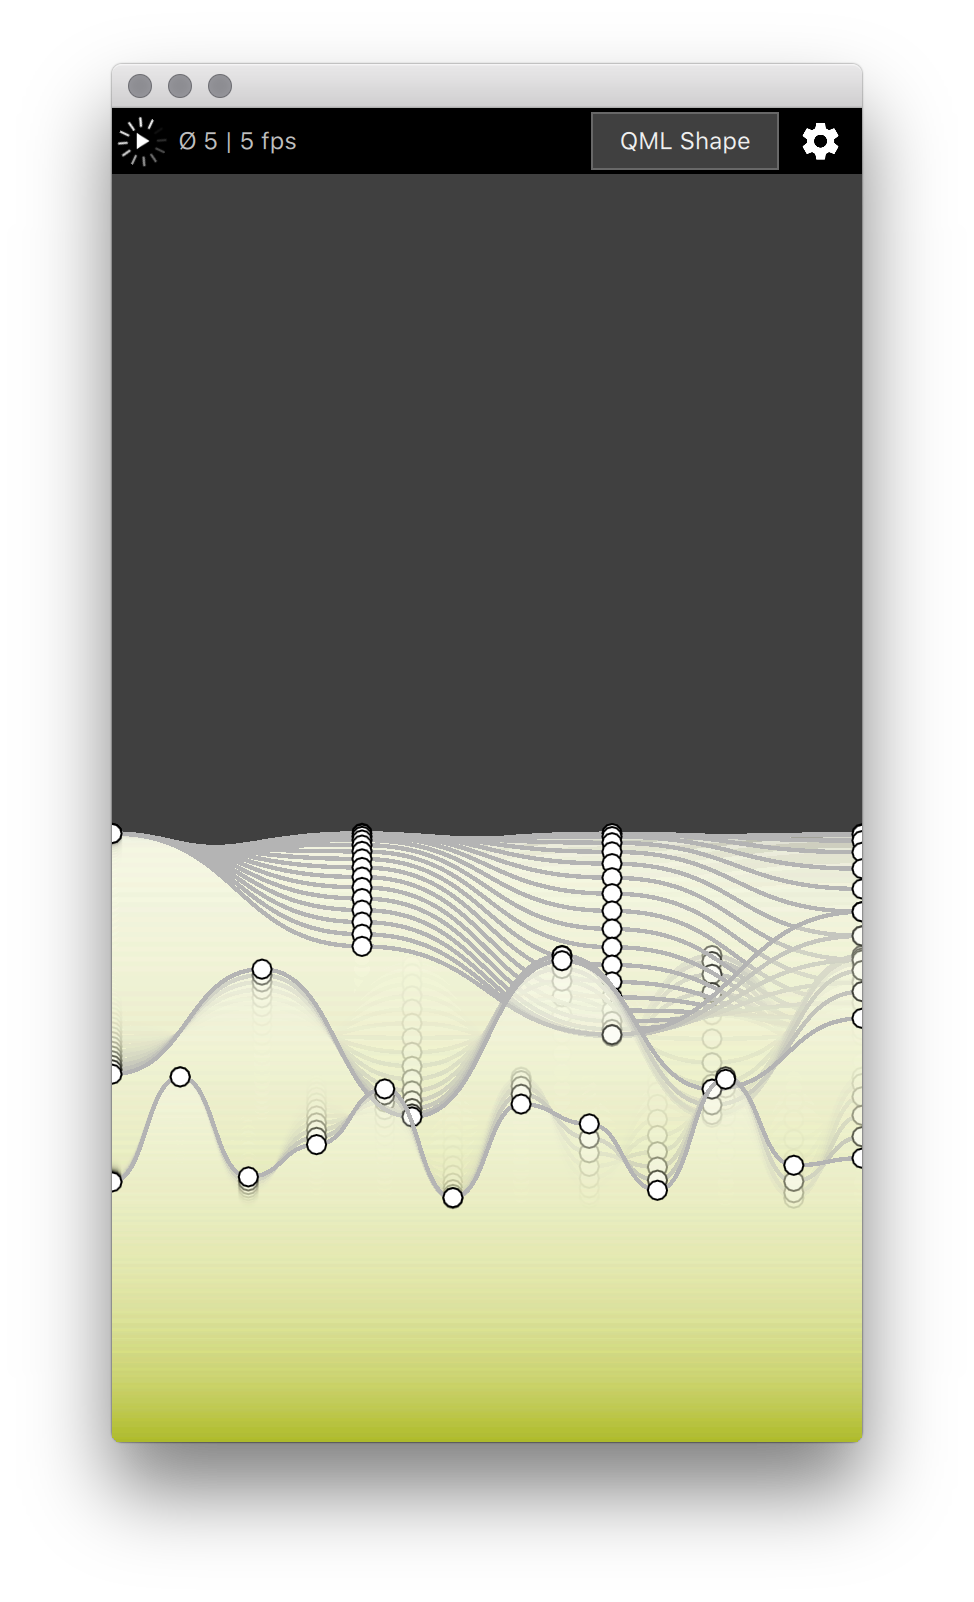
Once this is done, the results are pretty interesting. This is using the generic backend for Shapes (i.e. not NVIDIA, not software). Screen size is 1920x1080.
| What | Window size | FPS | %CPU |
|---|---|---|---|
| QNanoPainter | default | 45 | 12 |
| QNanoPainter | maximized | 46 | 13 |
| Shape | default | 60 | 66 |
| Shape | maximized | 29 | 31 |
This would point towards being GPU bound with Shape. The time spent on triangulating the stroke and fill in polish() is basically zero so it all points towards the lower end of the pipeline.
Now with LIBGL_ALWAYS_SOFTWARE=1 (i.e. llvmpipe)
| What | Window size | FPS | %CPU |
|---|---|---|---|
| QNanoPainter | default | 62 | 288 |
| QNanoPainter | maximized | 16 | 620 |
| Shape | default | 62 | 207 |
| Shape | maximized | 23 | 422 |
Shape performs better with this particular software rasterizer GL implementation, somewhat suprisingly.
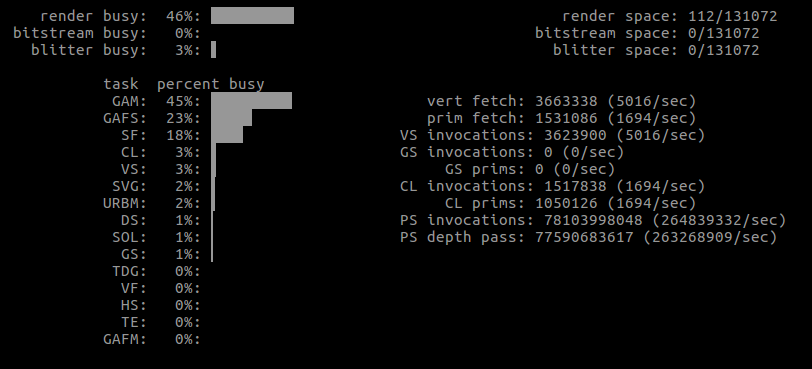
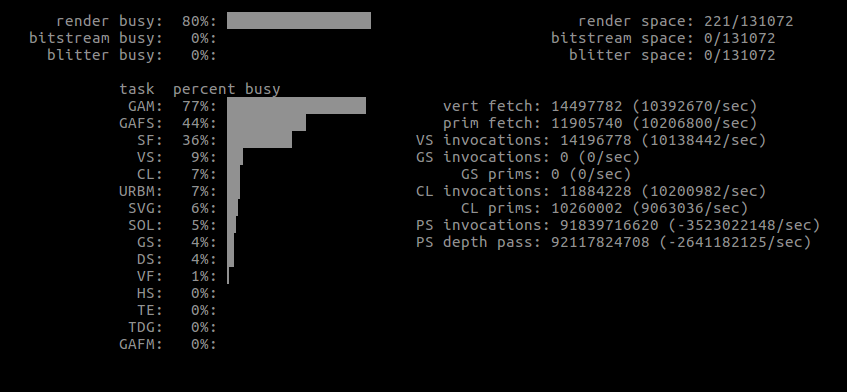
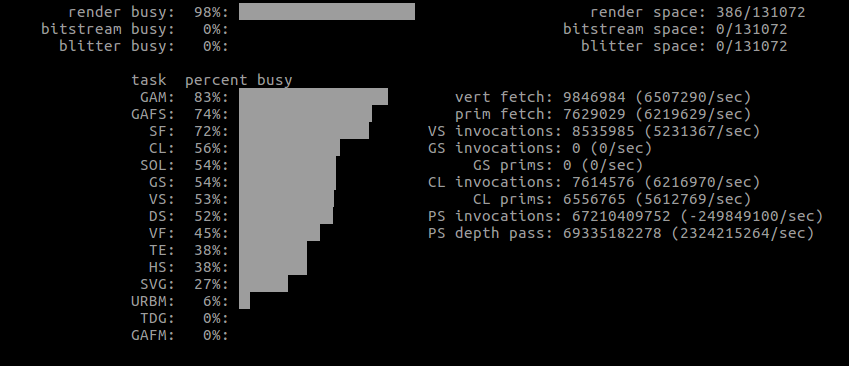
More importantly, some actual GPU usages from the first run.
| What | Window size | GPU |
|---|---|---|
| QNanoPainter | default |  |
| QNanoPainter | maximized | 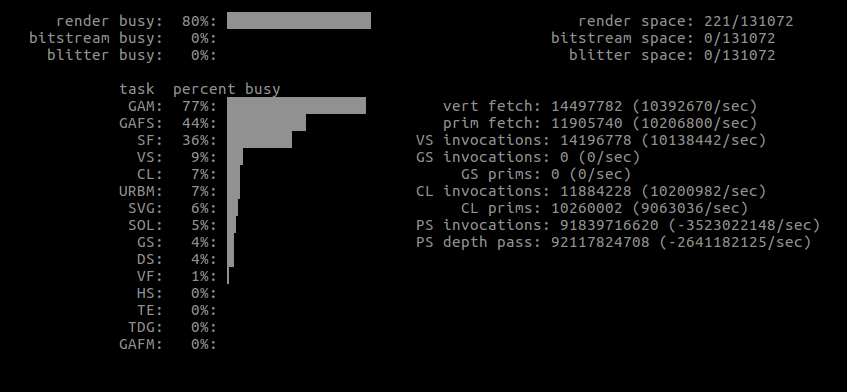 |
| Shape | default | 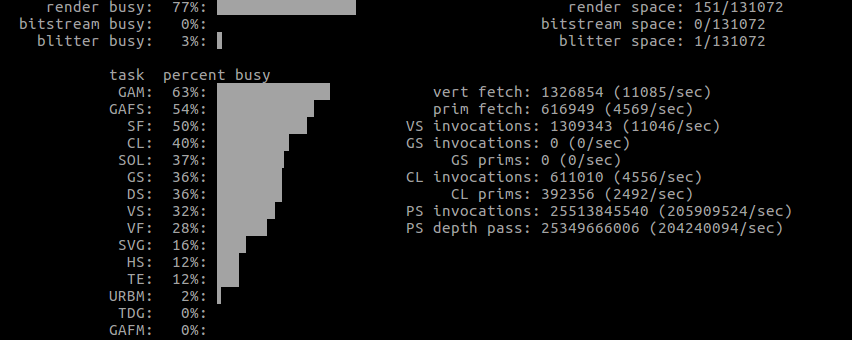 |
| Shape | maximized |  |
Note how the vertex count is significantly smaller with Shape, yet there seems to be a lot more work altogether.
Next up is RenderDoc or apitrace. The former is somewhat unstable on this Linux setup so just used apitrace - this is good enough since all we need is the dump of the GL calls.
See attached text files. One obvious difference is the presence of a suspicious glBlitFramebuffer call with Shapes - and the size is dependent on the scene size, meaning the blitted area becomes quite big when increasing the window size. Where does this come from?
Multisampling...
So it turns out the demo app uses a layer with layer.samples: 4 by default. Unless toggled in the advanced settings. This is pretty expensive, esp. when running fullscreen in full HD or something.
The NanoVG code path does not use multisample renderbuffers, though, not even when antialiasing is enabled in the settings. It rather uses NVG_ANTIALIAS the smart feather-based AA option to provide some level of smoothing without requiring multi or super sampling for the entire scene (or at least the FBO layer the item in question is in).
Thus the two approaches in the demo are not comparable. The Shape version will slow down as increasing the window size since it does MSAA for the entire renderbuffer and then blits to a texture to resolve the samples for every frame.
Without "antialiasing" (i.e. no multisample FBO, no NVG_ANTIALIAS) - just plain straight-to-window with Shapes and plain FBO with NanoVG - the results are:
| What | Window size | FPS | %CPU | GPU "render busy" |
|---|---|---|---|---|
| QNanoPainter | default | 45 | 11 | 26% |
| QNanoPainter | maximized | 46 | 16 | 75% |
| Shape | default | 60 | 52 | 22% |
| Shape | maximized | 60 | 62 | 72% |
The CPU usages are not quite satisfactory still but at least we are not GPU bound anymore ( + some jagged edges of course)
As for the QNanoPainter results, it is worth noting that the reduced FPS is somehow caused by the 'basic' render loop (which we default to on Mesa). Forcing 'threaded' gives 60 as expected (but with some flickering here and there). This should not be an issue on other platforms/drivers.
On actual devices this is still a problem, e.g. an an NVIDIA Shield TV (NV_path_rendering code path disabled, antialiasing/MSAA off, 1080p) we are heavily CPU bound with a bizarrely unstable frame rate of 37-60 FPS, while the QNanoPainter path works pretty well at a steady 60 FPS.
"flowers" on its own works well - because that particular Shape only changes the fill gradient which - while not cheap - does not need regenerating the actual geometry from the path.
Needs further investigation and some CPU profiling. A quick glance at callgrind does not reveal much more than bezier tessellation is expensive (but so it is, relatively, for NanoVG as well). It could be worth testing the GL_NV_path_rendering path in more detail as well since a brief run on the Shield TV with enableVendorExtensions: true showed better, but not not much better, results with a still too high CPU load. This would point to a bottleneck somewhere else outside of the shape backends.
New test round on Windows, desktop OpenGL, MSVC2015, debug build with a recent dev branch this time. No antialiasing, no NV_path_rendeirng.
| What | Window size | FPS | CPU | FPS without the Bezier test | CPU without the Bezier test |
|---|---|---|---|---|---|
| QNanoPainter | default | 60 | 27 | 60 | 26 |
| QNanoPainter | maximized | 60 | 28 | 60 | 28 |
| QPainter with GL2 paint engine (FBO) | default | 60 | 14 | 60 | 14 |
| QPainter with GL2 paint engine (FBO) | maximized | 60 | 20 | 60 | 20 |
| Shape | default | 16 | 29 | 60 | 30 |
| Shape | maximized | 10 | 29 | 60 | 30 |
With the latest QNanoPainter patches we can now run with OpenGL proper (no ANGLE), which is great. The results with everything enabled are fairly atrocious when it comes to Shape. Took the QPainter/GL numbers this time since internally this is somewhat similar to what Shape too. Disabling the Bezier test leads to somewhat different results, though.
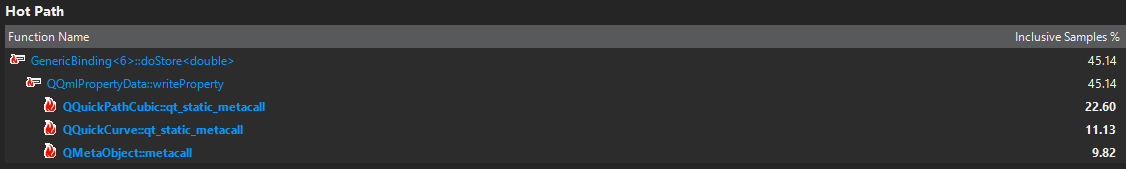
The MSVC profiler points to QML/V4 at first glance (property stuff, Math.sin, etc.) which I would interpret as LinesComponent.qml being too heavy with all those JS function calls in the PathCubic property bindings.


- relates to
-
QTBUG-61857 Potential Qt Quick Shape improvements
-
- Closed
-