Uploaded image for project: 'Qt'
  1. Qt
  2. QTBUG-65322

Can't see part of plot while range of axis nonnegative

XMLWordPrintable

    • Icon: Bug Bug
    • Resolution: Invalid
    • Icon: P2: Important P2: Important
    • None
    • 5.9.1, 5.9.2, 5.9.3, 5.10.0
    • Data Visualization
    • None
    • Debian 9.3 x64 + gnome 3.22.2
      Windows

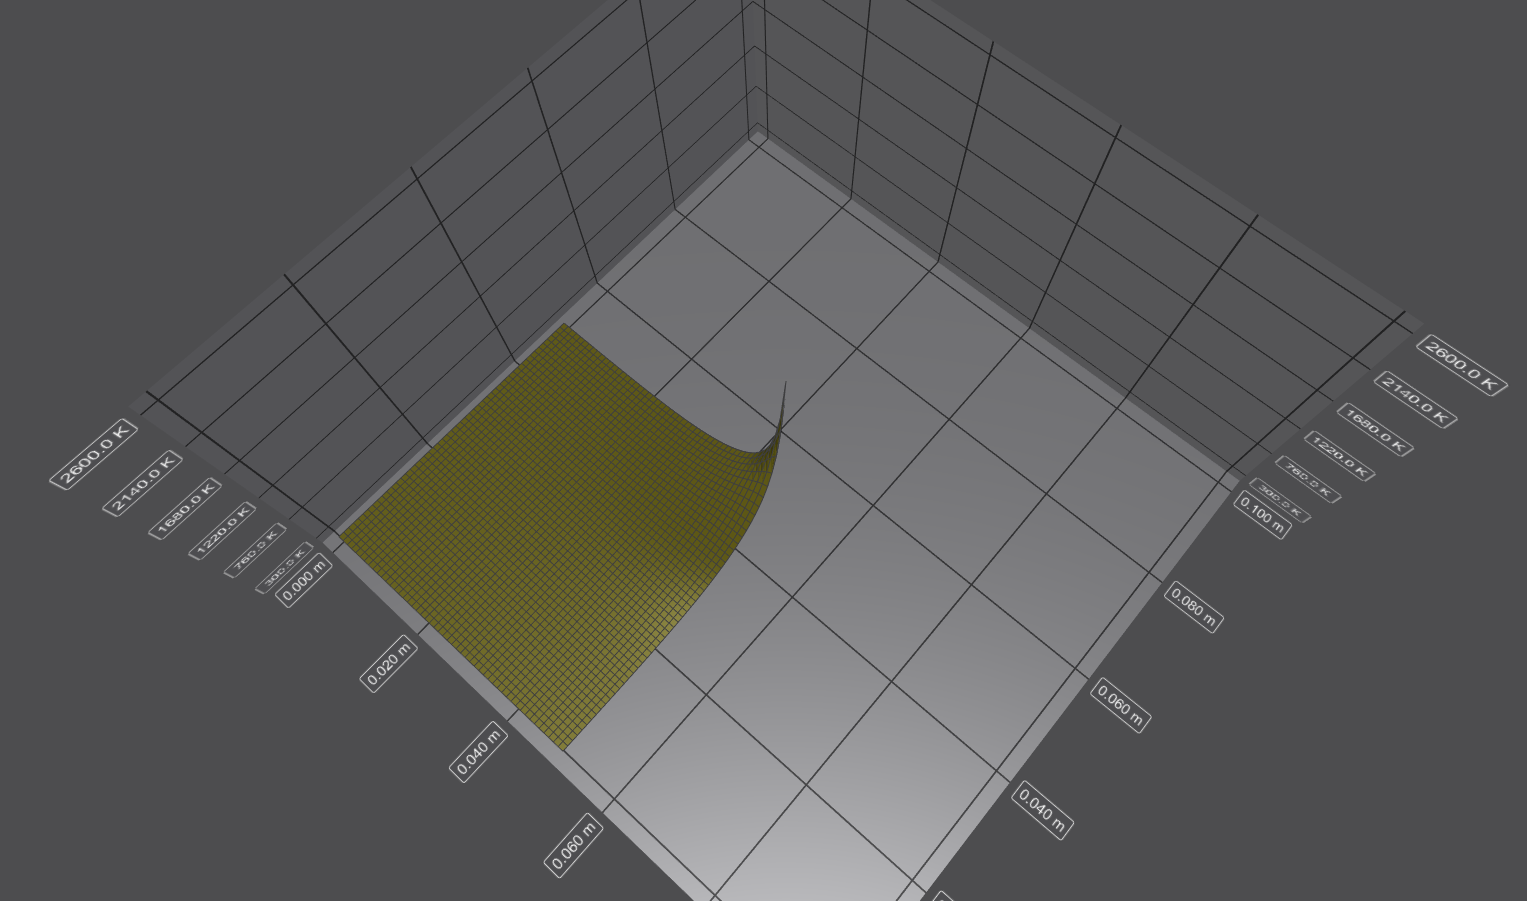
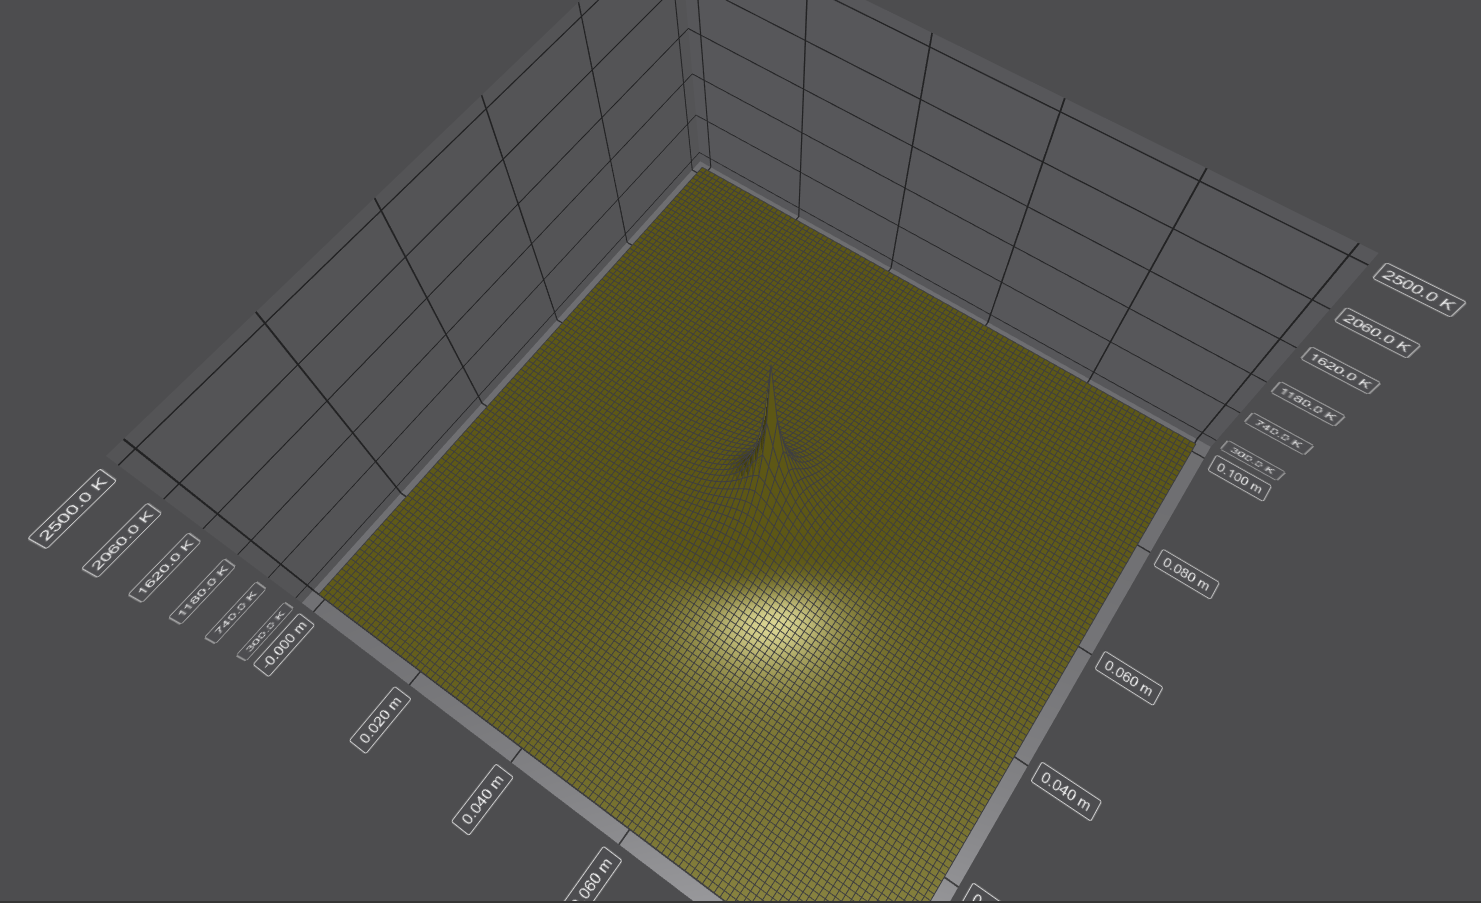
      When I use Q3DSurface and try to set non-negative range on some axis only a part of a plot is displayed (see screenshot 1, the range was set with setRange(0, 0.1)). If I set the min value as negative then the surface is displayed as expected (screenshot 2, done with setRange(- FLT_EPSILON, 0.1)).

        No reviews matched the request. Check your Options in the drop-down menu of this sections header.

            oulu_hillbilly Sami Varanka
            mustafadjan Anton Mustafin
            Votes:
            0 Vote for this issue
            Watchers:
            3 Start watching this issue

              Created:
              Updated:
              Resolved:

                There are no open Gerrit changes