-
Bug
-
Resolution: Invalid
-
 P2: Important
-
None
-
5.9.1, 5.9.2, 5.9.3, 5.10.0
-
None
-
Debian 9.3 x64 + gnome 3.22.2
Windows
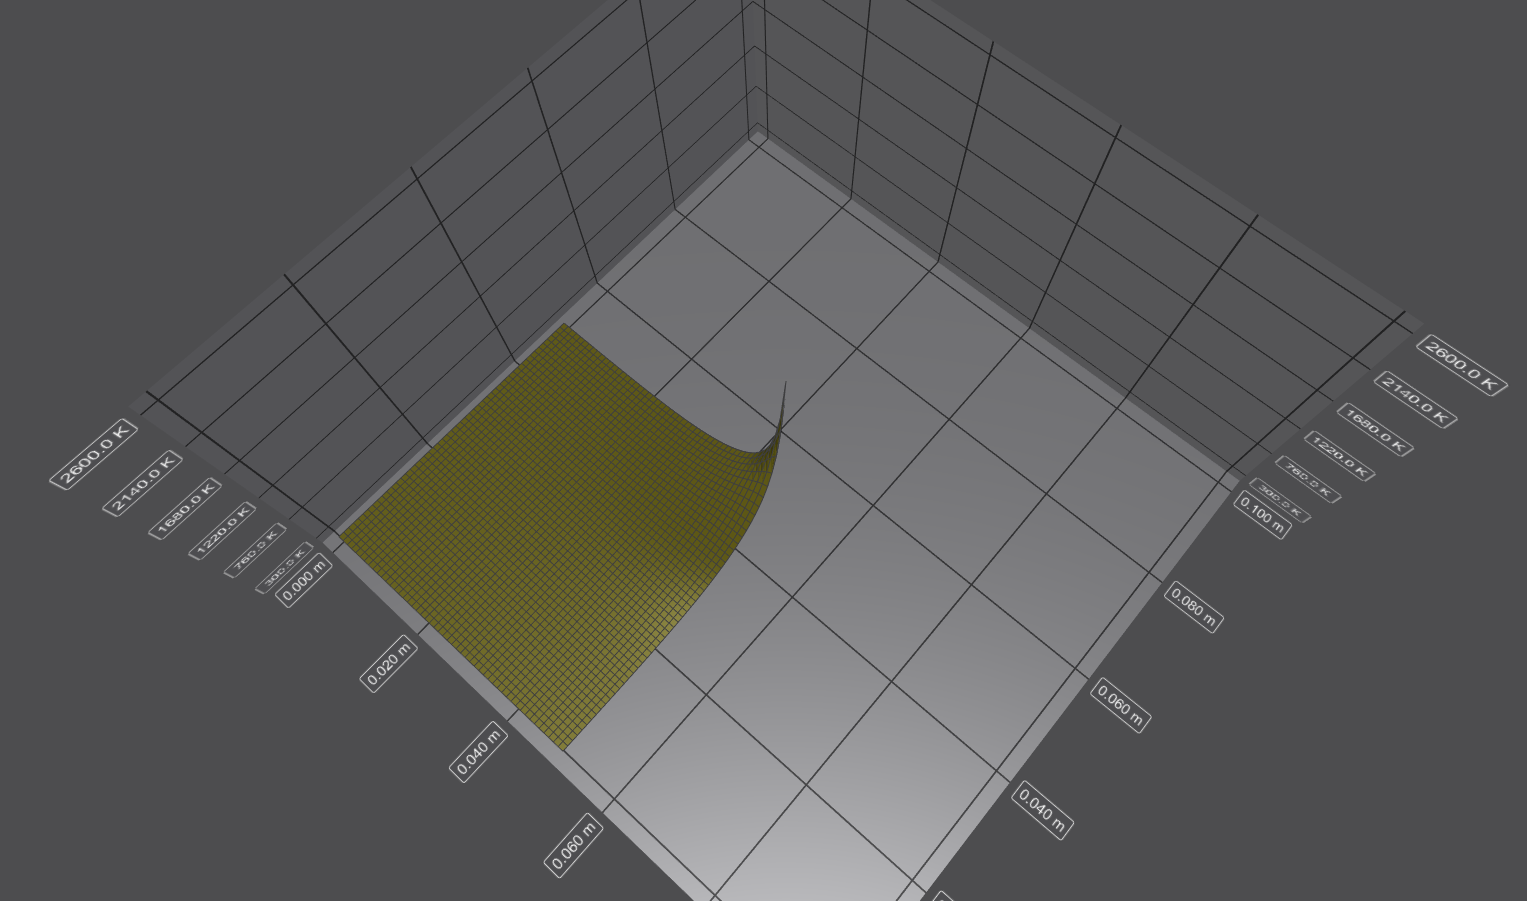
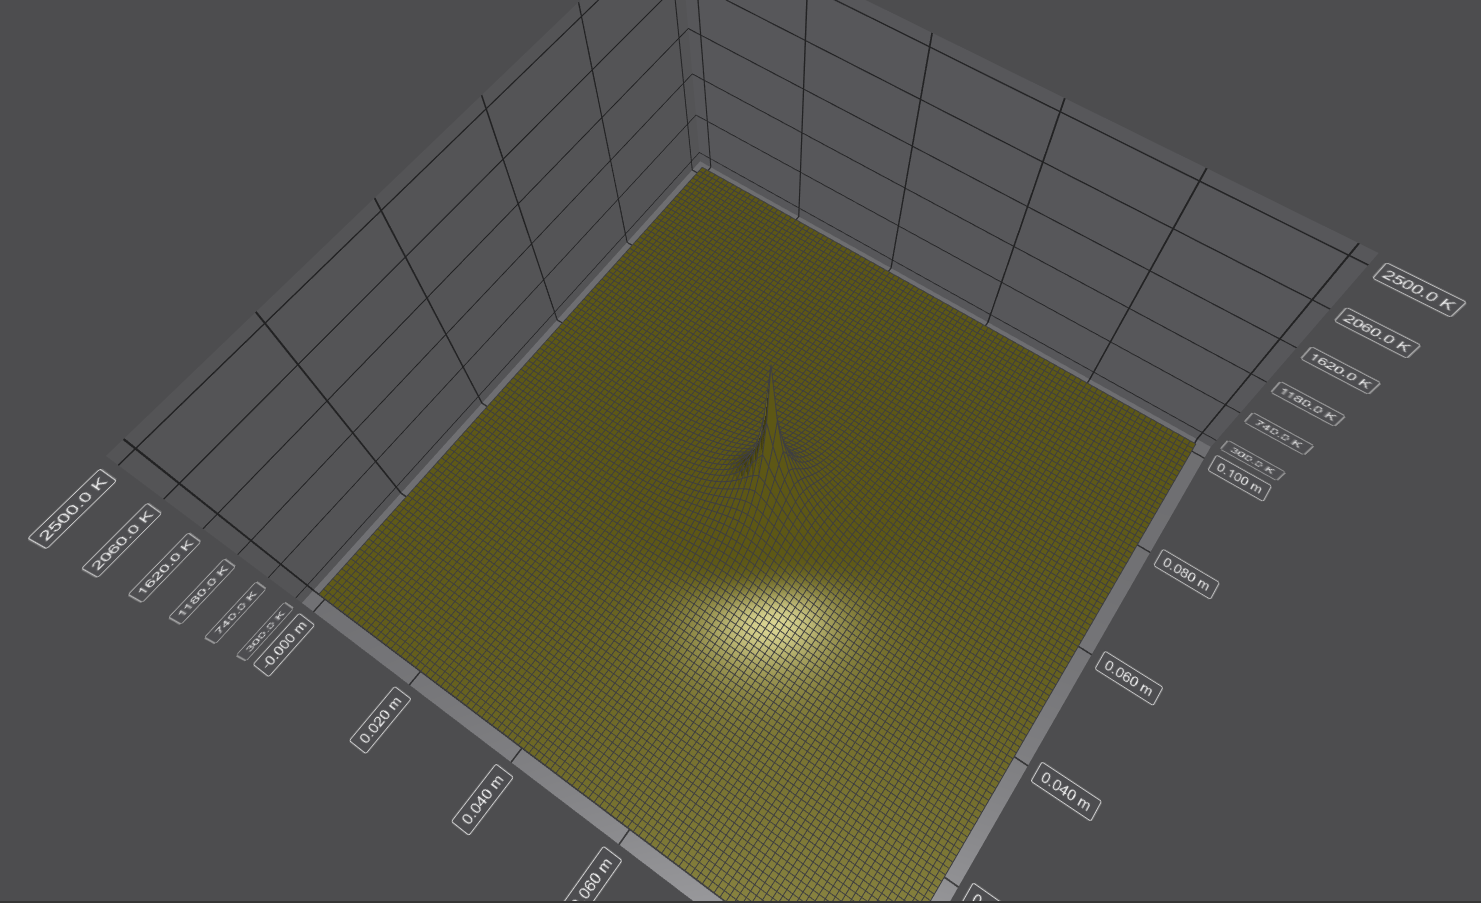
When I use Q3DSurface and try to set non-negative range on some axis only a part of a plot is displayed (see screenshot 1, the range was set with setRange(0, 0.1)). If I set the min value as negative then the surface is displayed as expected (screenshot 2, done with setRange(- FLT_EPSILON, 0.1)).
- mentioned in
-
Page Loading...
| For Gerrit Dashboard: QTBUG-65322 | ||||||
|---|---|---|---|---|---|---|
| # | Subject | Branch | Project | Status | CR | V |
| 360067,1 | Fix: invalid samplerec with nonnegative axis | dev | qt/qtdatavis3d | Status: ABANDONED | 0 | 0 |